Idaho's 2025 Harvest Numbers Are In: Here's What They Mean for Fall 2026
Idaho Fish and Game just published their annual hunter harvest report, and the headline is clear: elk and mule deer harvests climbed for the second straight year, recovering from the 2023 low that followed a brutal winter. But harvest totals only tell part of the story. The real question is how these trends stack up against the environmental conditions shaping up for the 2026 season.
Elk Numbers Look Strong, But Elevation Will Matter
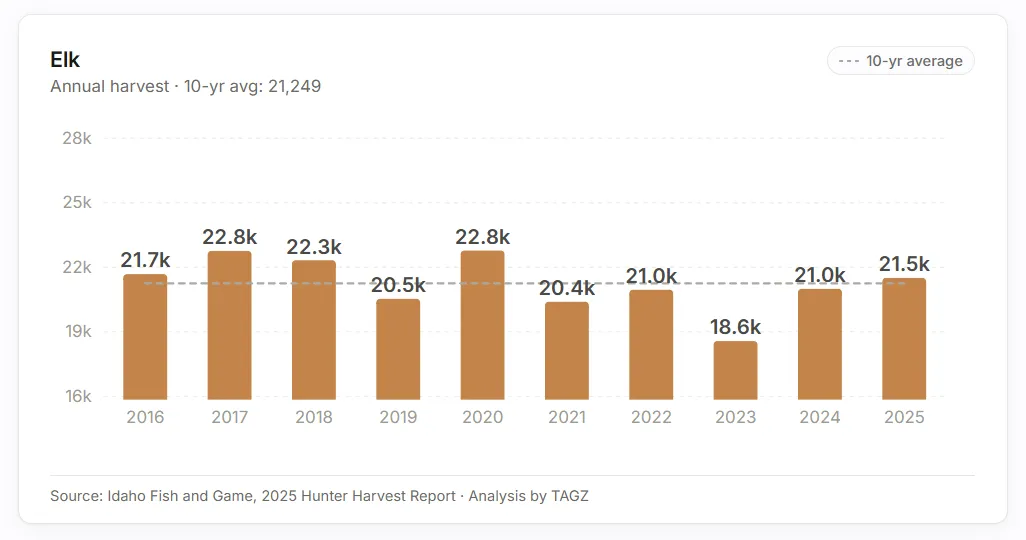
Hunters took 21,505 elk in 2025, up 2.4% from 2024 and nearly identical to the 10-year average. Success rates held steady at 23%, and six-point bull harvest reached a five-year high. All signals point to stable, healthy elk populations.
But context matters. The sharp drop in 2023 harvests wasn’t due to fewer elk, it was about access. That year’s dry summer drove elk higher, out of reach for most hunters. Fast-forward to 2026: Idaho just had its warmest winter on record, and April snowpack is near historic lows. If the summer turns hot and dry again, expect elk to push above 9,000 feet, leaving general-season hunters glassing empty timber at lower elevations.
On paper, your favorite unit’s draw odds might look great. But it pays to dig into terrain data: elevation bands, reliable water, and north-facing slopes will determine where elk actually hold during a drought year.
Mule Deer Rebound Is Real, But Recovery Is Fragile
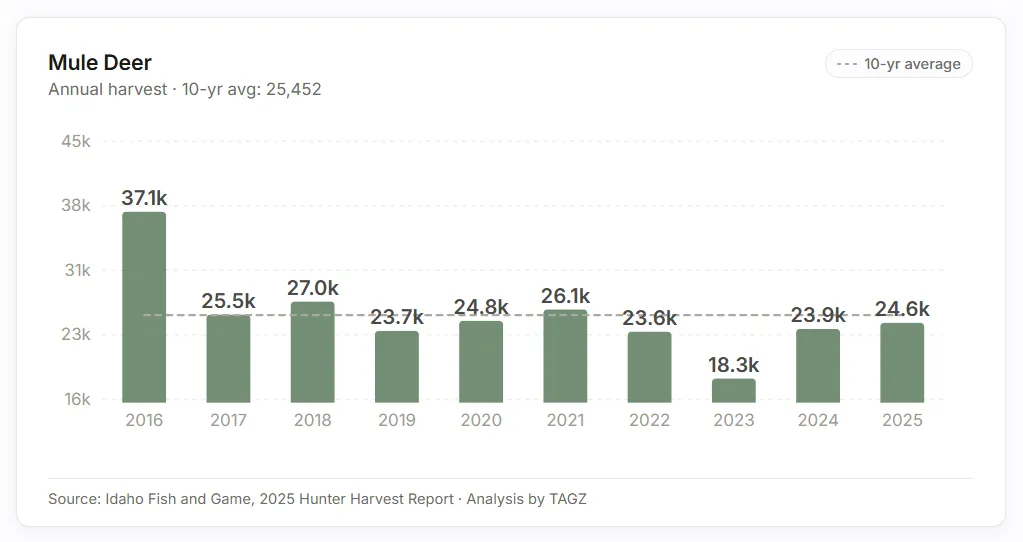
Mule deer harvest rose to 24,589, a 2.8% increase over 2024, with a 32% success rate. About 2,500 more hunters hit the field than last year. IDF&G reports more mature bucks showing up and four-point harvest numbers on the rise since the 2022–2023 nadir.
Still, the recovery is on a knife’s edge. More hunters during a rebound phase means more pressure on rebuilding herds. If drought conditions hurt fawn survival this summer, expect the state to tighten quotas or add restrictions in 2027. Keep an eye on Unit 73A’s archery/muzzleloader experiment, if it delivers strong buck numbers, similar management strategies could expand elsewhere.
One statistical note: the massive 2016 harvest (37,070) skews the 10-year average higher. Remove that outlier, and 2025’s harvest lands right on pace with a more realistic trendline.
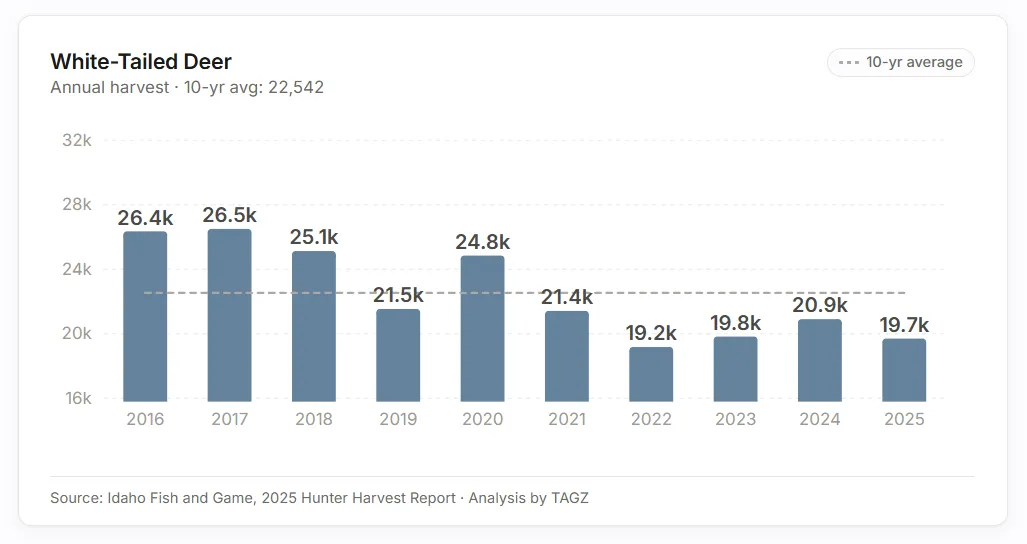
White-Tailed Deer: EHD’s Impact and the 2026 Outlook
White-tailed deer harvest slipped to 19,702, down from 20,908 in 2024. IDF&G anticipated this drop after an EHD outbreak hammered the Clearwater and Panhandle regions in late July, similar to the 2021 event. The good news: populations were robust going in, so statewide harvests held steady and buck maturity remains solid (five-point bucks still over 20% of harvest).
The risk for 2026? EHD flares up in hot, dry summers with stagnant water — exactly what the forecast suggests. Back-to-back outbreak years are rare but possible. If you’re eyeing a whitetail hunt in Clearwater or the Panhandle, keep tabs on local conditions right through August.
CWD: The Slow-Moving Wildcard
CWD didn’t make headlines in the harvest report, but it’s creeping into the picture. Idaho expanded mandatory testing to seven GMUs in 2025, and detections now top 100 since 2021. While prevalence is still low, the geographic spread is growing. If detection rates climb, hunters could see reduced tags, shorter seasons, or new carcass transport rules. It’s a developing risk that’s worth tracking.
Plan for the Year Ahead
The 2025 harvest data is reassuring: elk are stable, mule deer are climbing, and whitetails weathered EHD. But remember, harvest stats reflect where herds were — not where they’ll be if drought persists. For 2026, plan smarter: scout for water sources, study elevation and north-facing aspects, and monitor real-time conditions. Don’t count on last year’s honey hole if the landscape dries up and the animals move.
Source: Idaho Fish and Game Hunter Harvest Report, April 2026. All harvest figures, success rates, and wildlife management commentary are drawn from IDF&G's published data. Charts built by TAGZ using IDF&G data. Analysis and forward-looking commentary are our own.
Was this article helpful?
Previous
Beginner Elk Hunt Across the West: Ultimate Guide for First-Time Success
First-time elk hunters in the West face tough conditions, changing regulations, and a steep learning curve. Here’s how to prepare, hunt smarter, and avoid common mistakes for a better shot at success.
Next
I Waited 10 Years for a Colorado Mule Deer Tag… Was It Worth It?
After waiting a decade for a coveted Colorado mule deer tag, the reality did not match the expectation. Discover the lessons learned about patience, expectations, and the value of frequent hunting experiences.