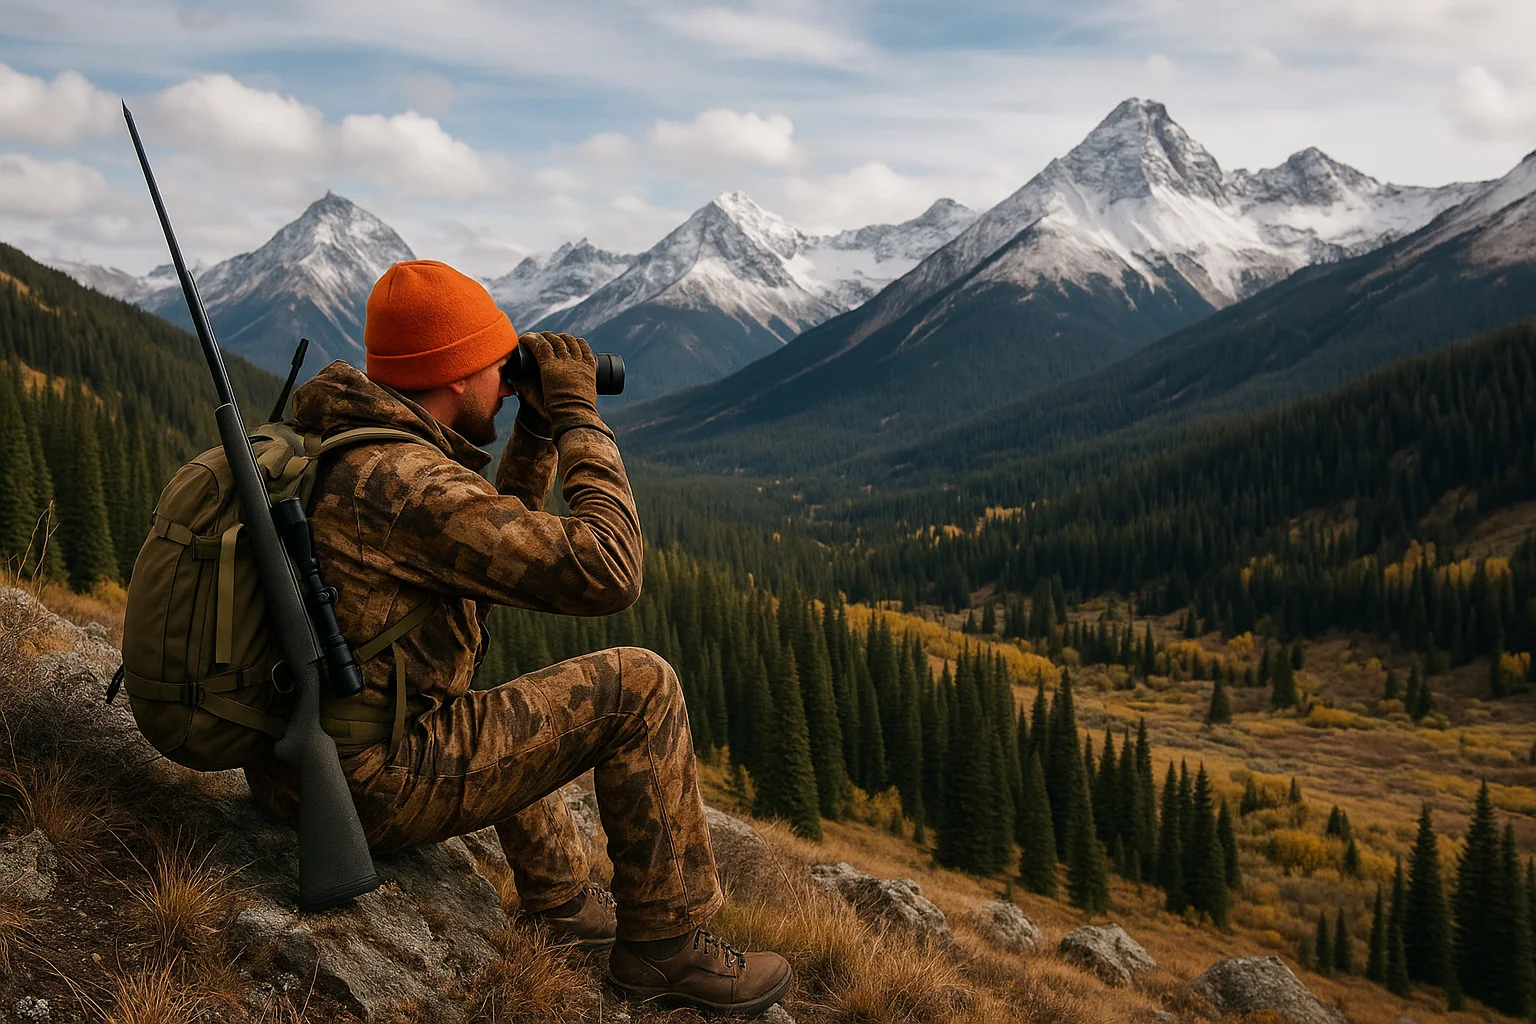
How TAGZ Helps You Draw a Big Game Tag in Colorado
Getting Started with TAGZ
TAGZ helps you navigate Colorado's complex draw system by consolidating data from multiple sources and organizing it into an intuitive flow that simplifies hunt planning. Through a color-coded map and personalized filtering, you can quickly identify which units give you the best chances based on your accumulated points and hunting preferences.
This guide walks you through the complete workflow for using TAGZ to plan your Colorado big game hunt, from setting up your profile to analyzing specific units in depth.
Set Up Your Profile First
Before exploring the dashboard, you need to establish two critical pieces of information that directly affect your draw odds: your date of birth and state of residence.
Colorado distinguishes draw applicants by age group (youth vs. adult) and residency status (resident vs. nonresident). Limited license quotas (and the historical application trends behind them) look dramatically different across these categories.
Your Hunter Profile
To set up your profile, click the avatar button in the bottom-left corner of the interface, then select My Profile. Enter your date of birth and choose your state of residence. If you live in Colorado, select Colorado; if you live anywhere else, select your home state.
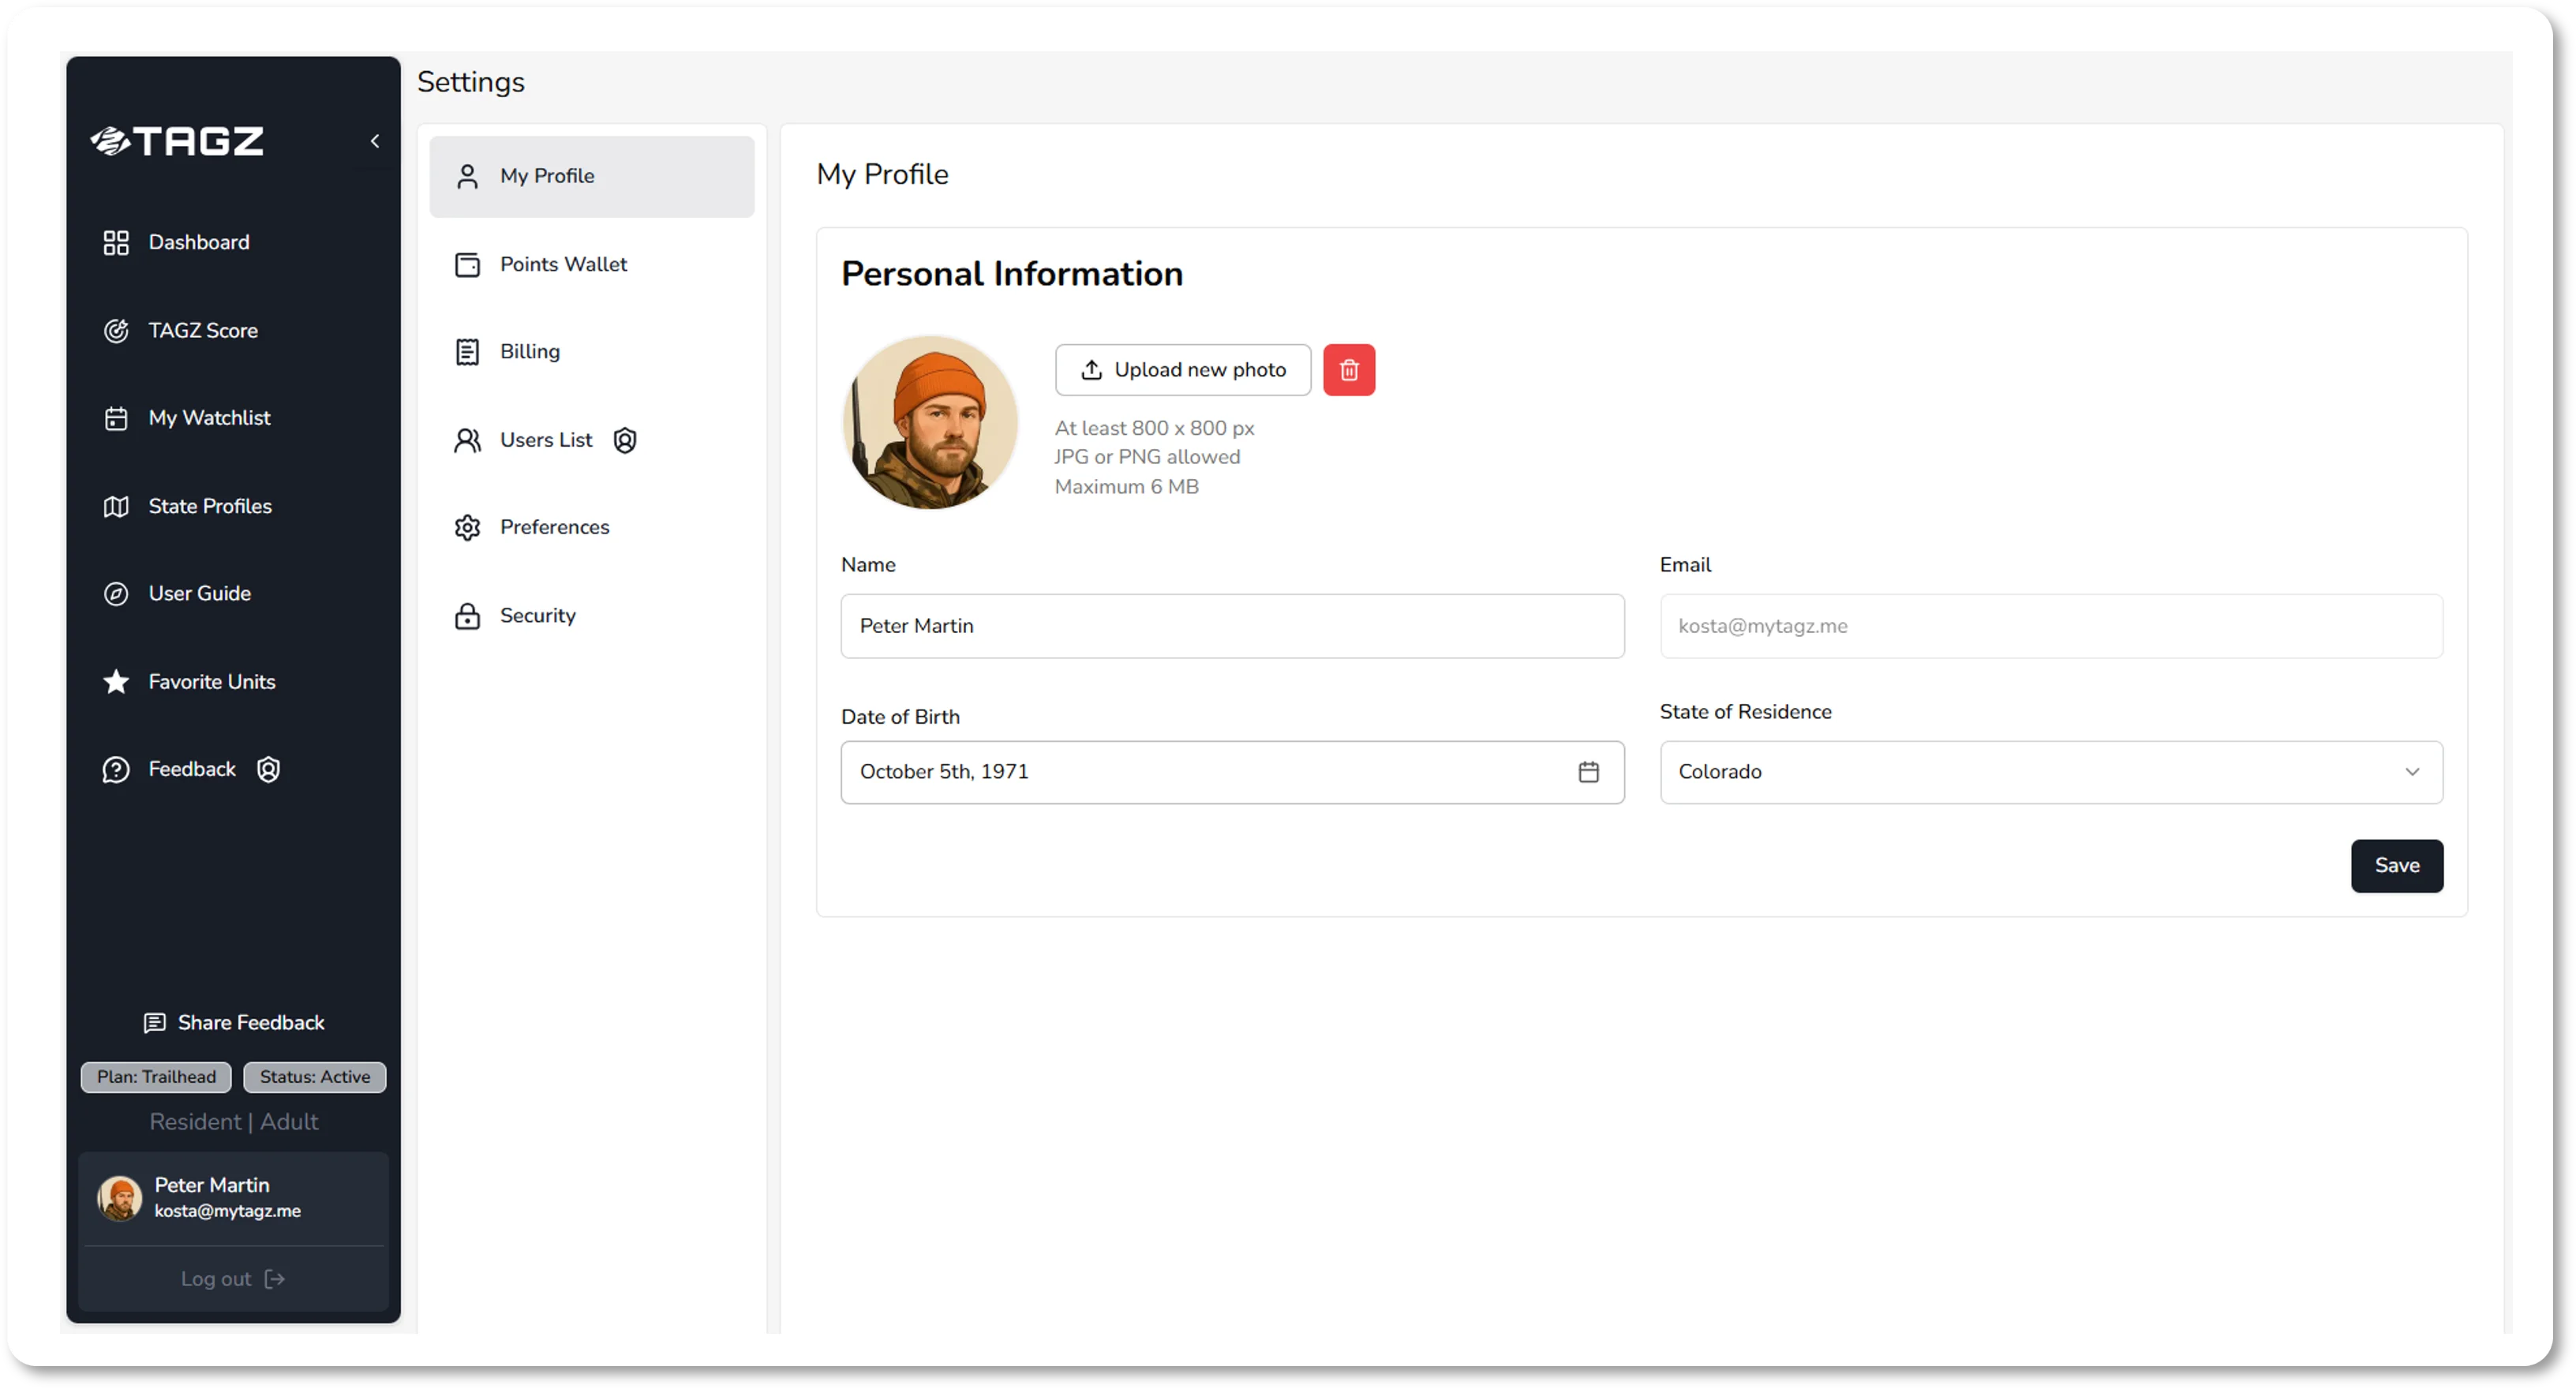
These two inputs determine your participant type, which falls into one of four categories:
- Resident Adult
- Resident Youth
- Nonresident Adult
- Nonresident Youth
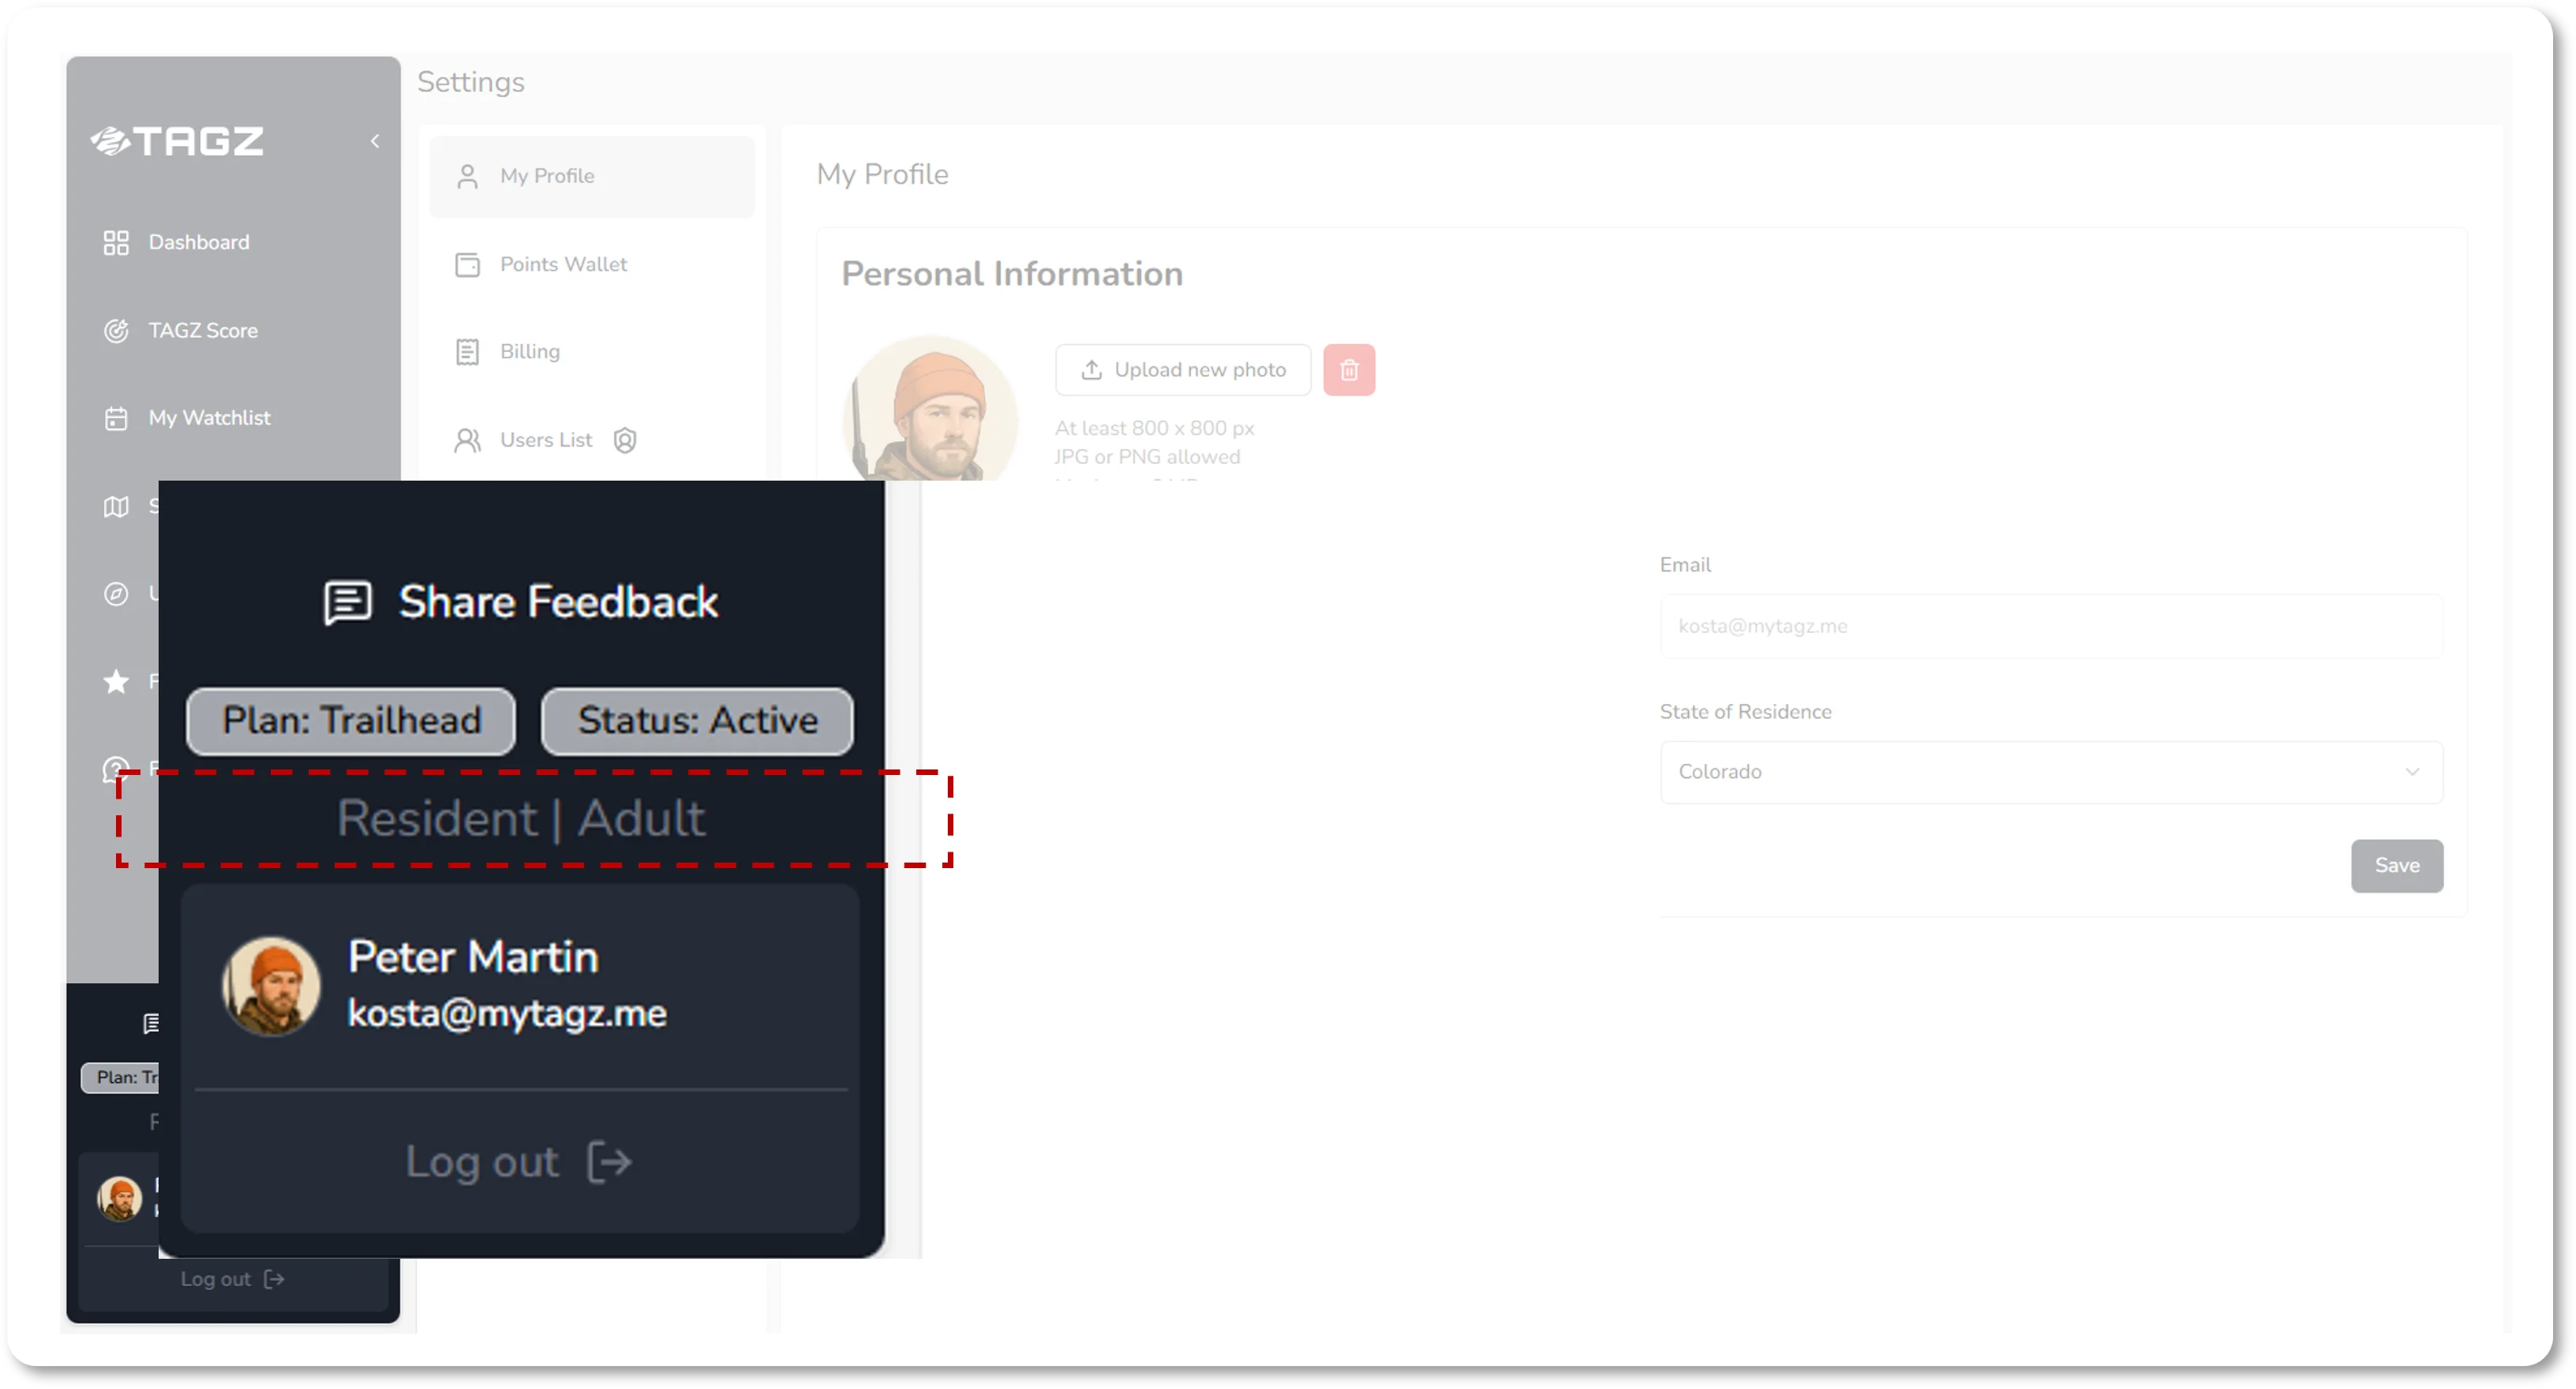
A resident adult's odds for a particular hunt can be entirely different from a nonresident adult's odds for the same unit and season. Setting up your profile correctly ensures the dashboard automatically shows results tailored to your participant type. Your profile settings will display at the bottom of the sidebar for quick reference throughout your planning sessions.
Fill Your Points Wallet
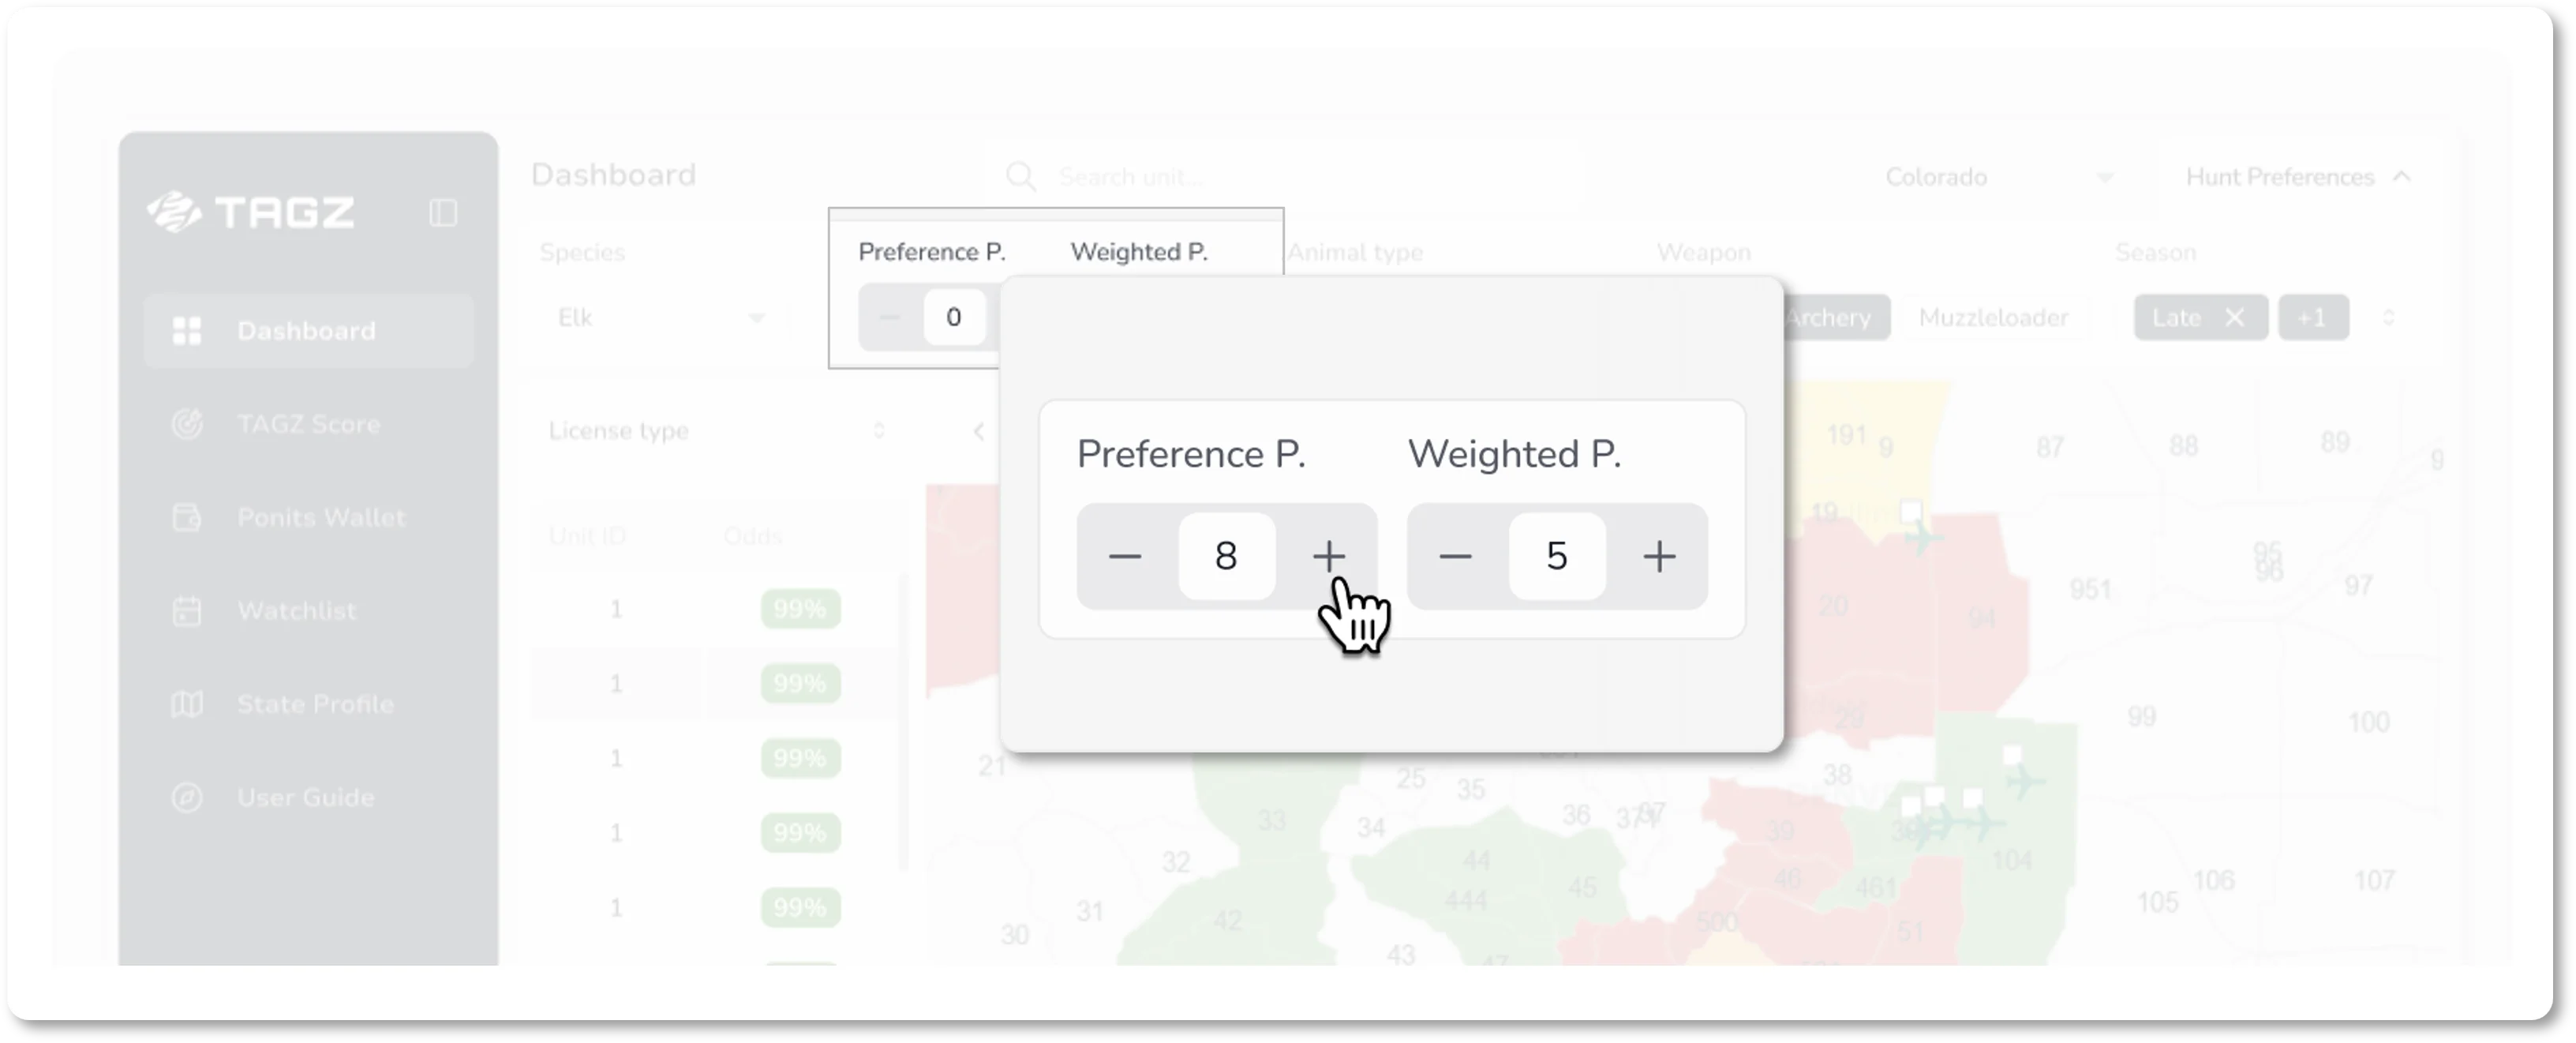
Your preference and weighted points are the currency that drive your odds of drawing a tag. TAGZ provides a streamlined Points Wallet that keeps track of your totals across all species, giving you one organized place to manage them.
To access your Points Wallet, go to Settings and select Points Wallet. Here you can enter your available points for every species. This information is contained in your Colorado Parks & Wildlife account and includes preference points for deer, elk, pronghorn, and bear, as well as weighted points for moose, Rocky Mountain bighorn sheep, and mountain goat (which require three years of preference points before weighted points begin accumulating). Desert bighorn sheep do not use points: their draw remains purely random each year.
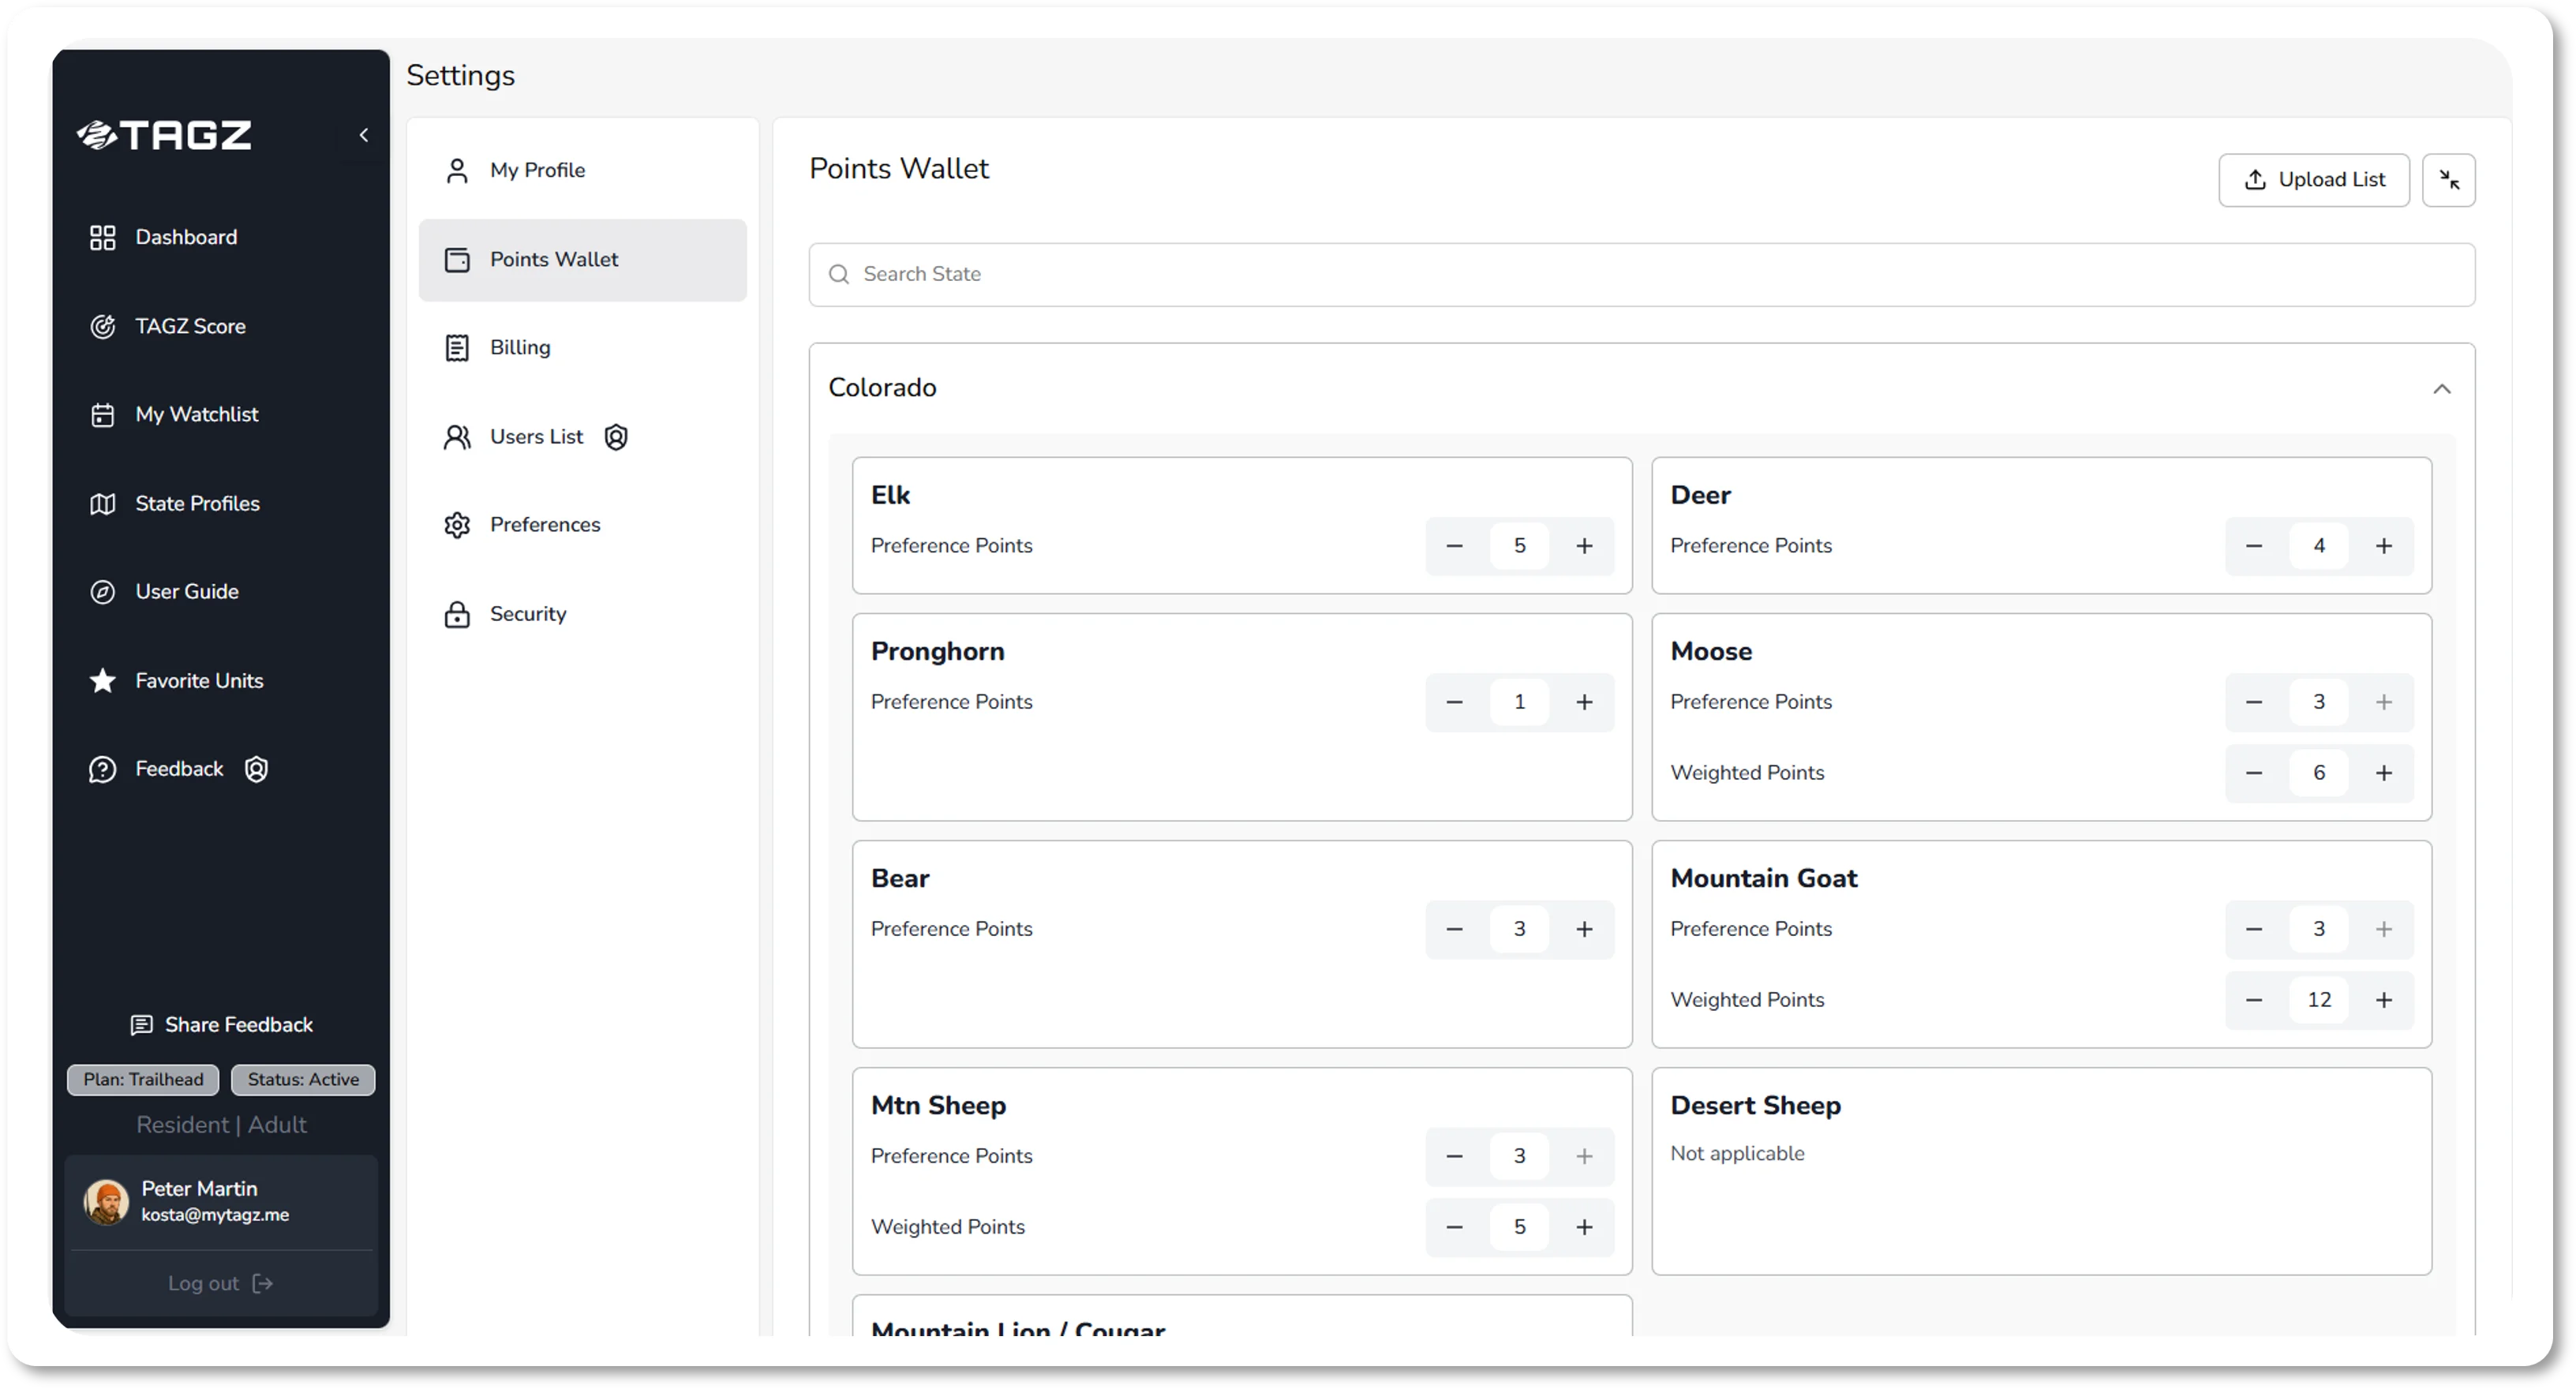
You can enter your points manually through the wallet interface. Once you save your points, this data automatically populates every time you search for a species. If you didn't fill in your Points Wallet beforehand, you can still manually adjust points in the dashboard control panel during your filtering session, but those changes won't be saved permanently. To update your baseline permanently, always edit your Points Wallet directly.
Navigate the Dashboard
The TAGZ Dashboard gives you a complete view of all available hunting opportunities and your personalized odds of drawing a limited license. Once your profile and Points Wallet are configured, you're ready to start filtering.
Select Your State and Species
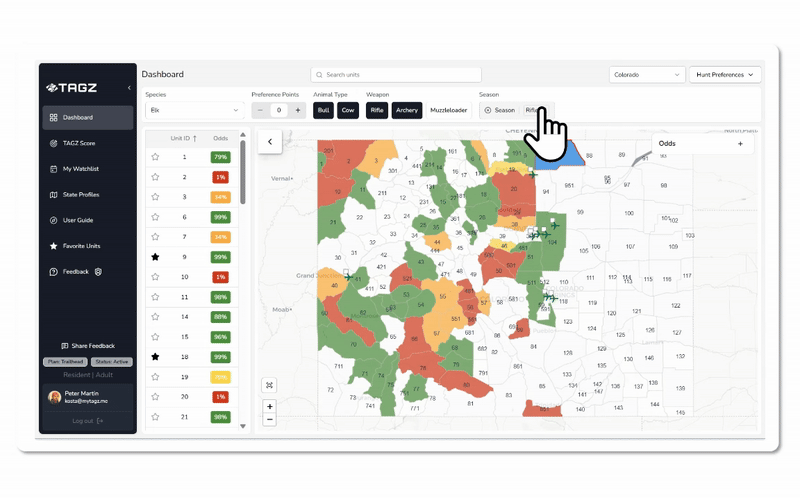
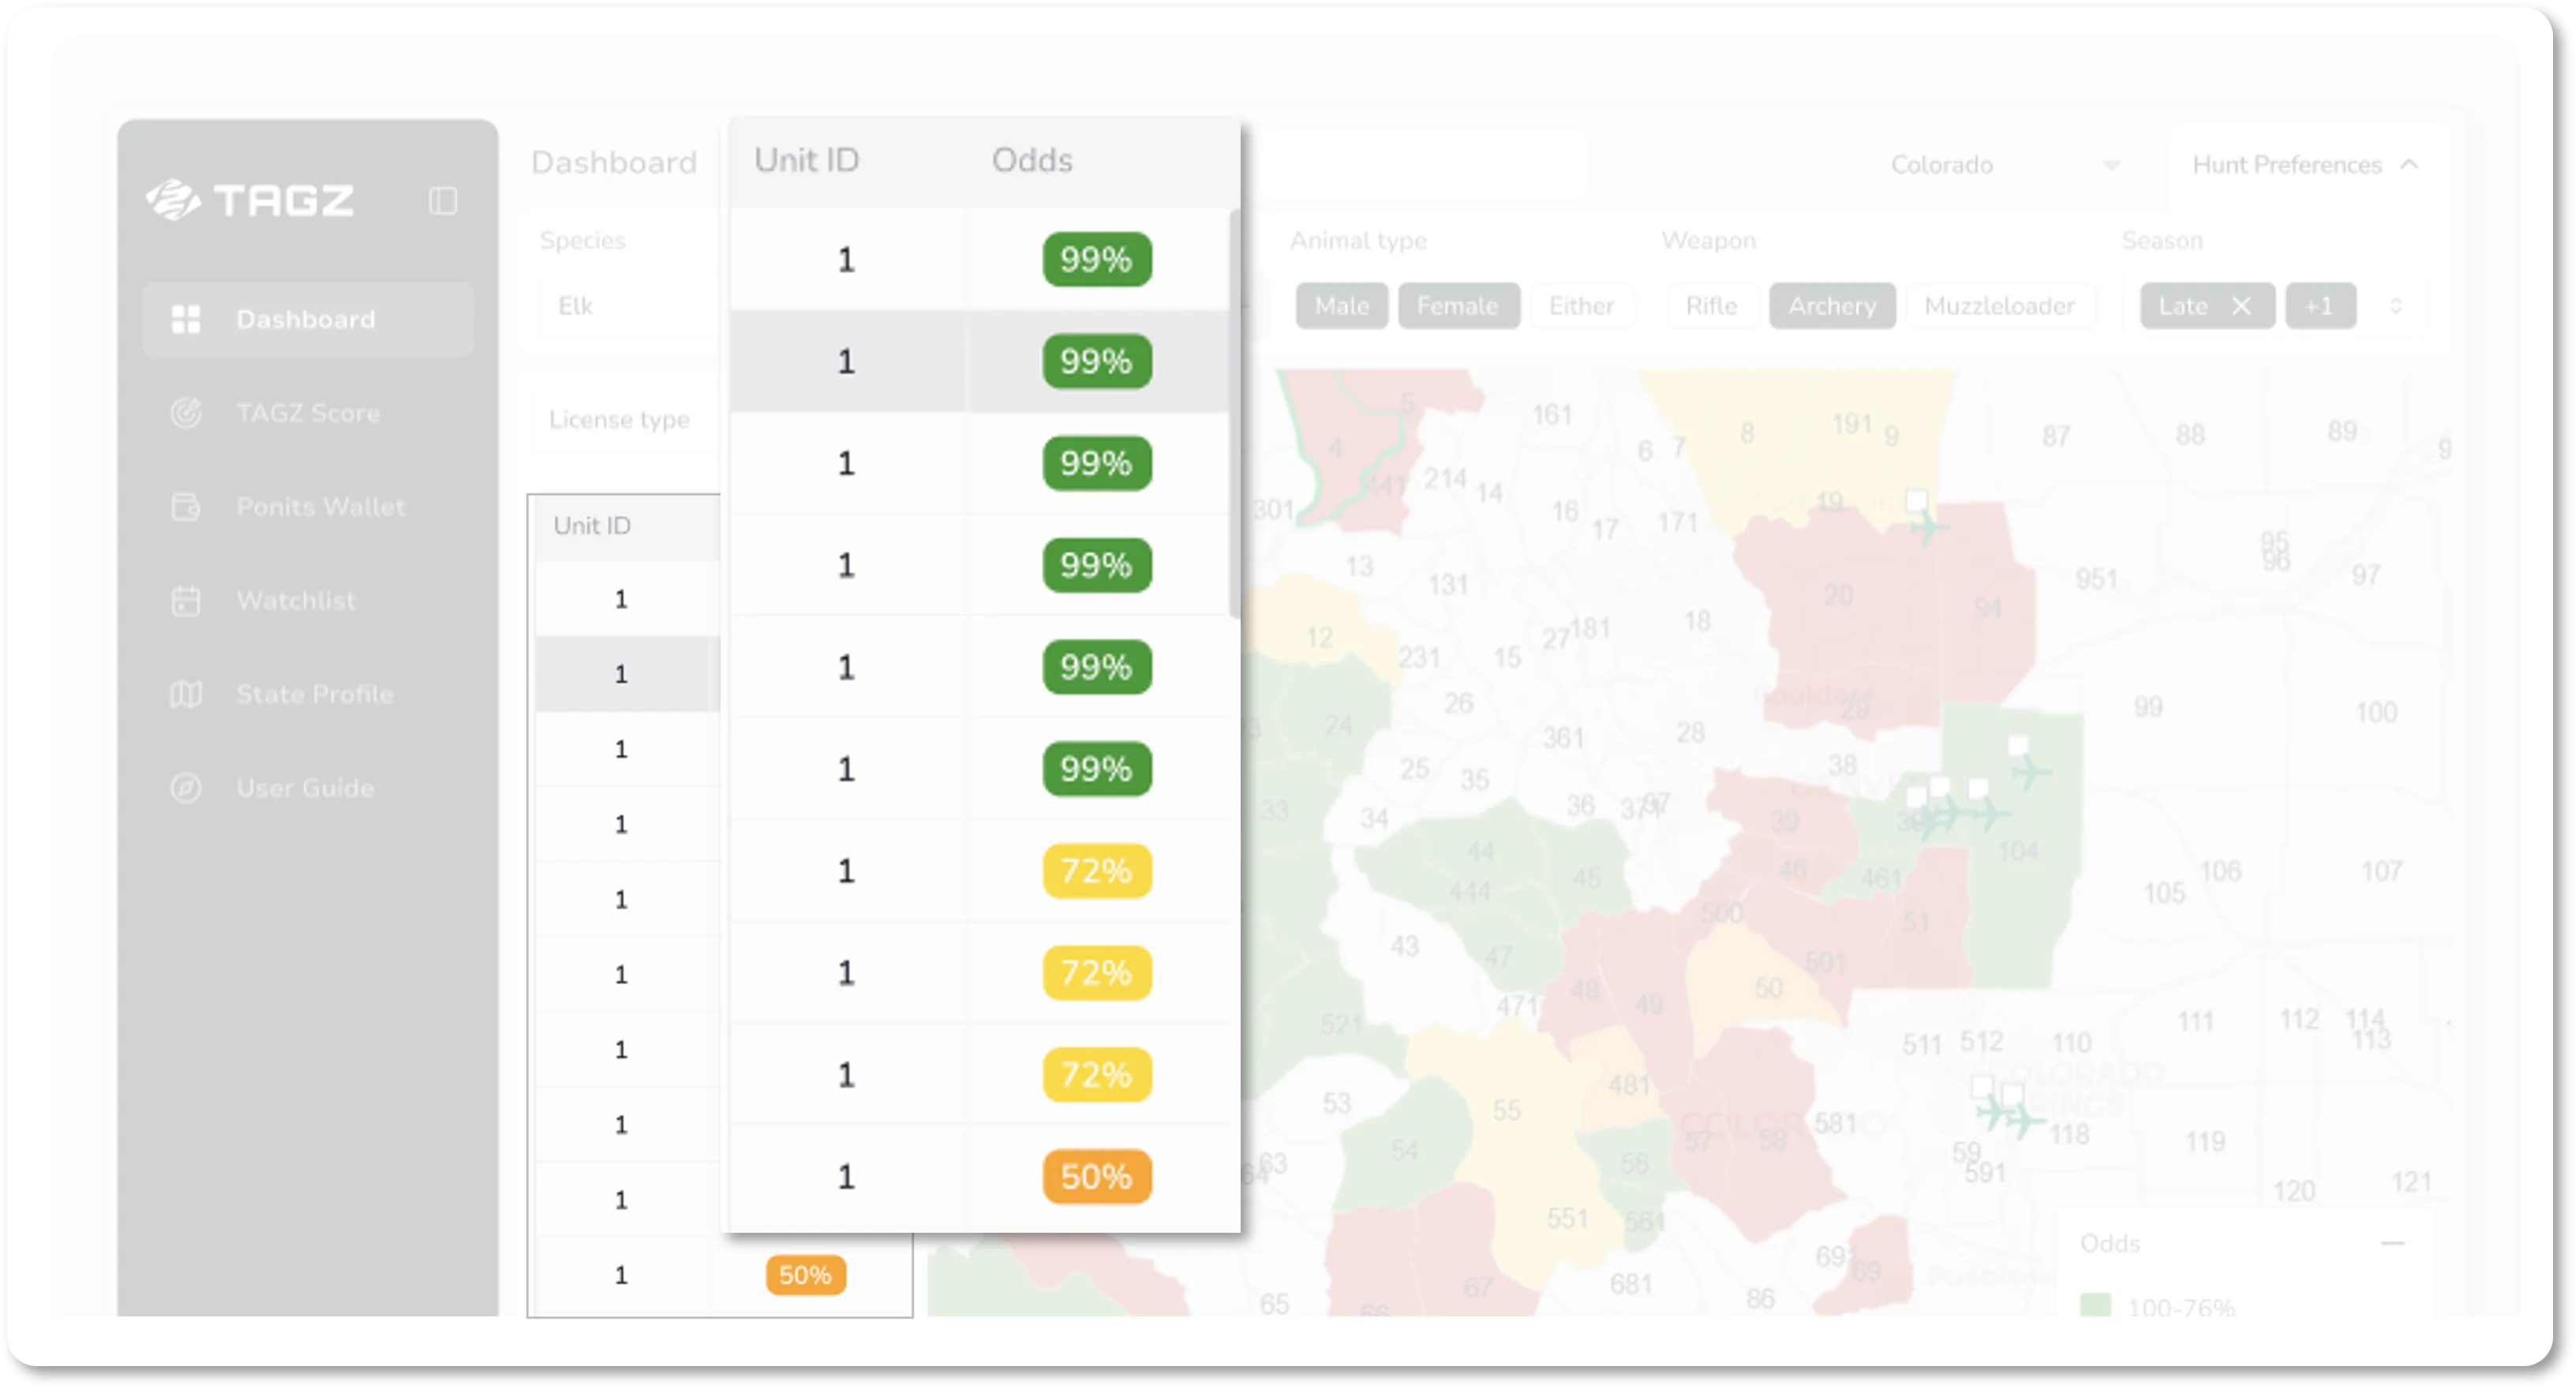
From the main dashboard, select Colorado from the dropdown of states. You'll see three main elements: a list of units, an interactive map, and the control panel.
Colorado uses three different map layers corresponding to different species groups:
- Big Game map: deer, elk, pronghorn, moose, and bear
- Mountain goat map: mountain goat only
- Sheep map: Rocky Mountain bighorn sheep and desert bighorn sheep
Start by selecting your species in the control panel. Once selected, your preference points and weighted points (where applicable) automatically populate from your Points Wallet. You can still temporarily adjust these values in the control panel if you want to explore "what-if" scenarios, but remember, these changes apply only to your current filtering session and won't overwrite your saved wallet.
Apply Cascading Filters
The filters are contextual and flow in sequence, where each upstream filter limits the availability of downstream filters. This ensures you never see irrelevant combinations.
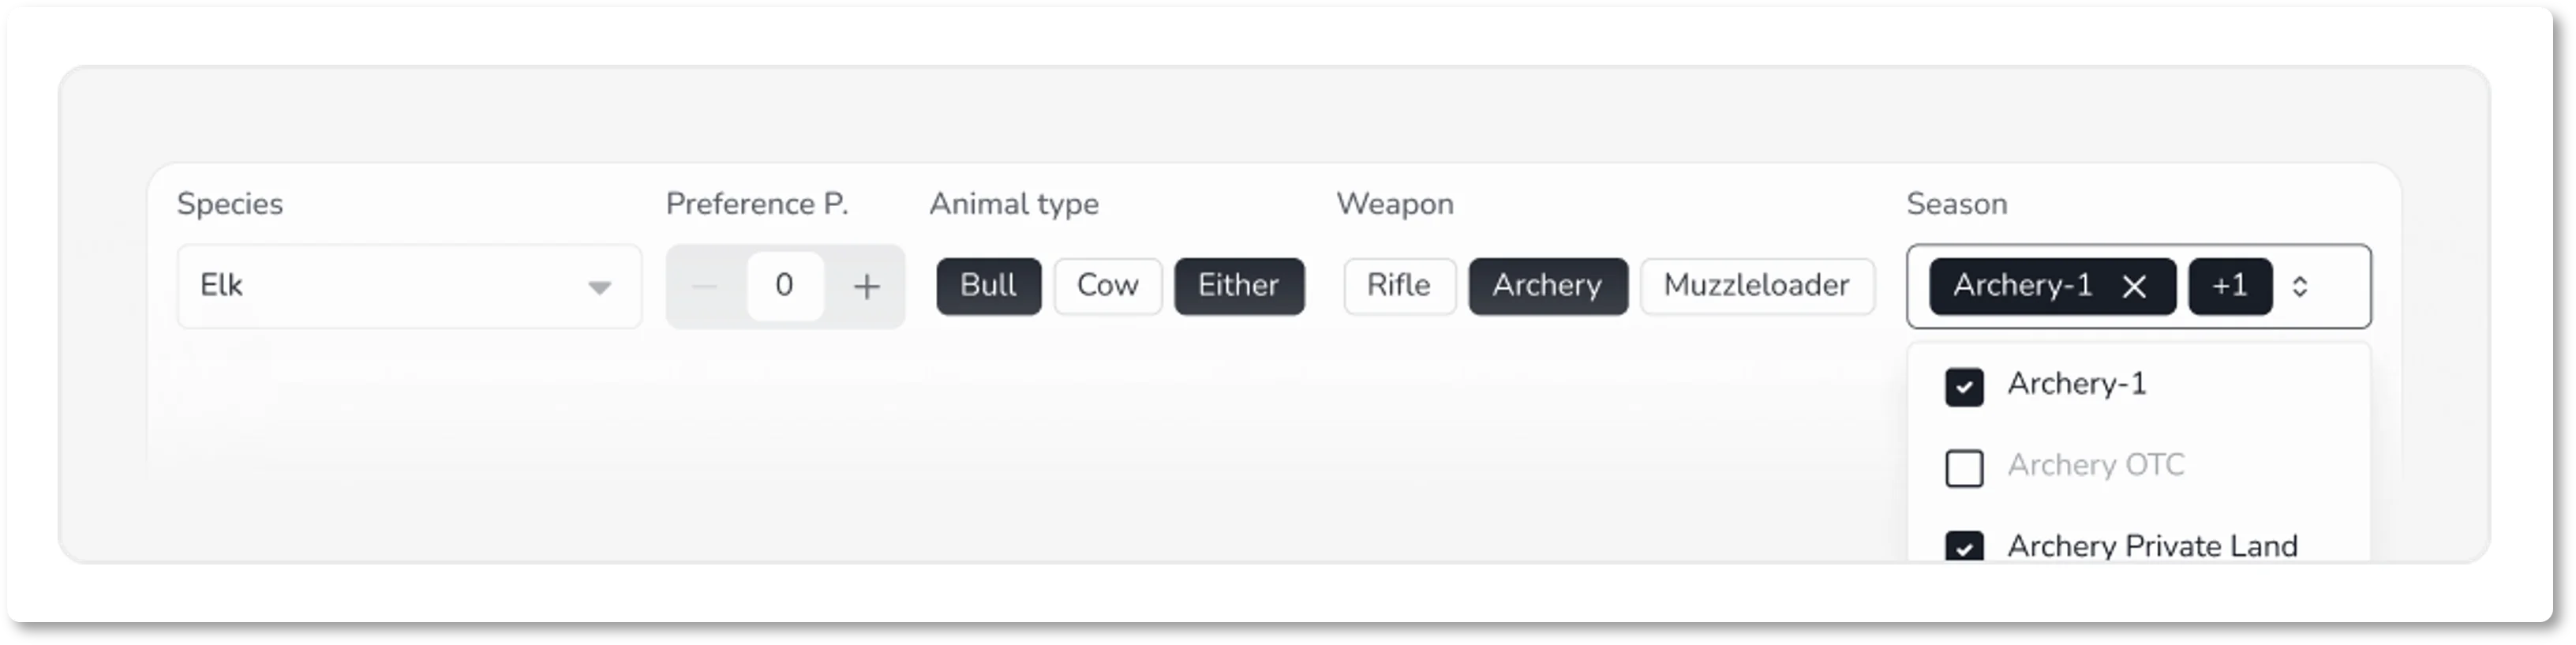
After selecting your species, choose your animal type (for example, bull elk, cow elk, or either-sex elk). The weapon options then adjust to show only those available for your chosen animal type. Next, select your weapon: archery, muzzleloader, or rifle.
Finally, pick your season. The season dropdown displays only those options that exist for your specific combination of species, animal type, and weapon. TAGZ covers all 64 Big Game seasons defined by Colorado Parks & Wildlife, including mainstream seasons like archery, the four rifle seasons, muzzleloader, and late rifle, as well as less common options such as Ranching for Wildlife, Private Land Only, Special, and Split seasons. This comprehensive coverage ensures no option slips past your planning.
Interpret the Map and Unit List
Once you select a season, your map and unit list populate simultaneously. If a unit is colored on the map, it means a limited license for your chosen species, animal type, weapon, and season is available in that unit for the current draw year: you can apply for it.
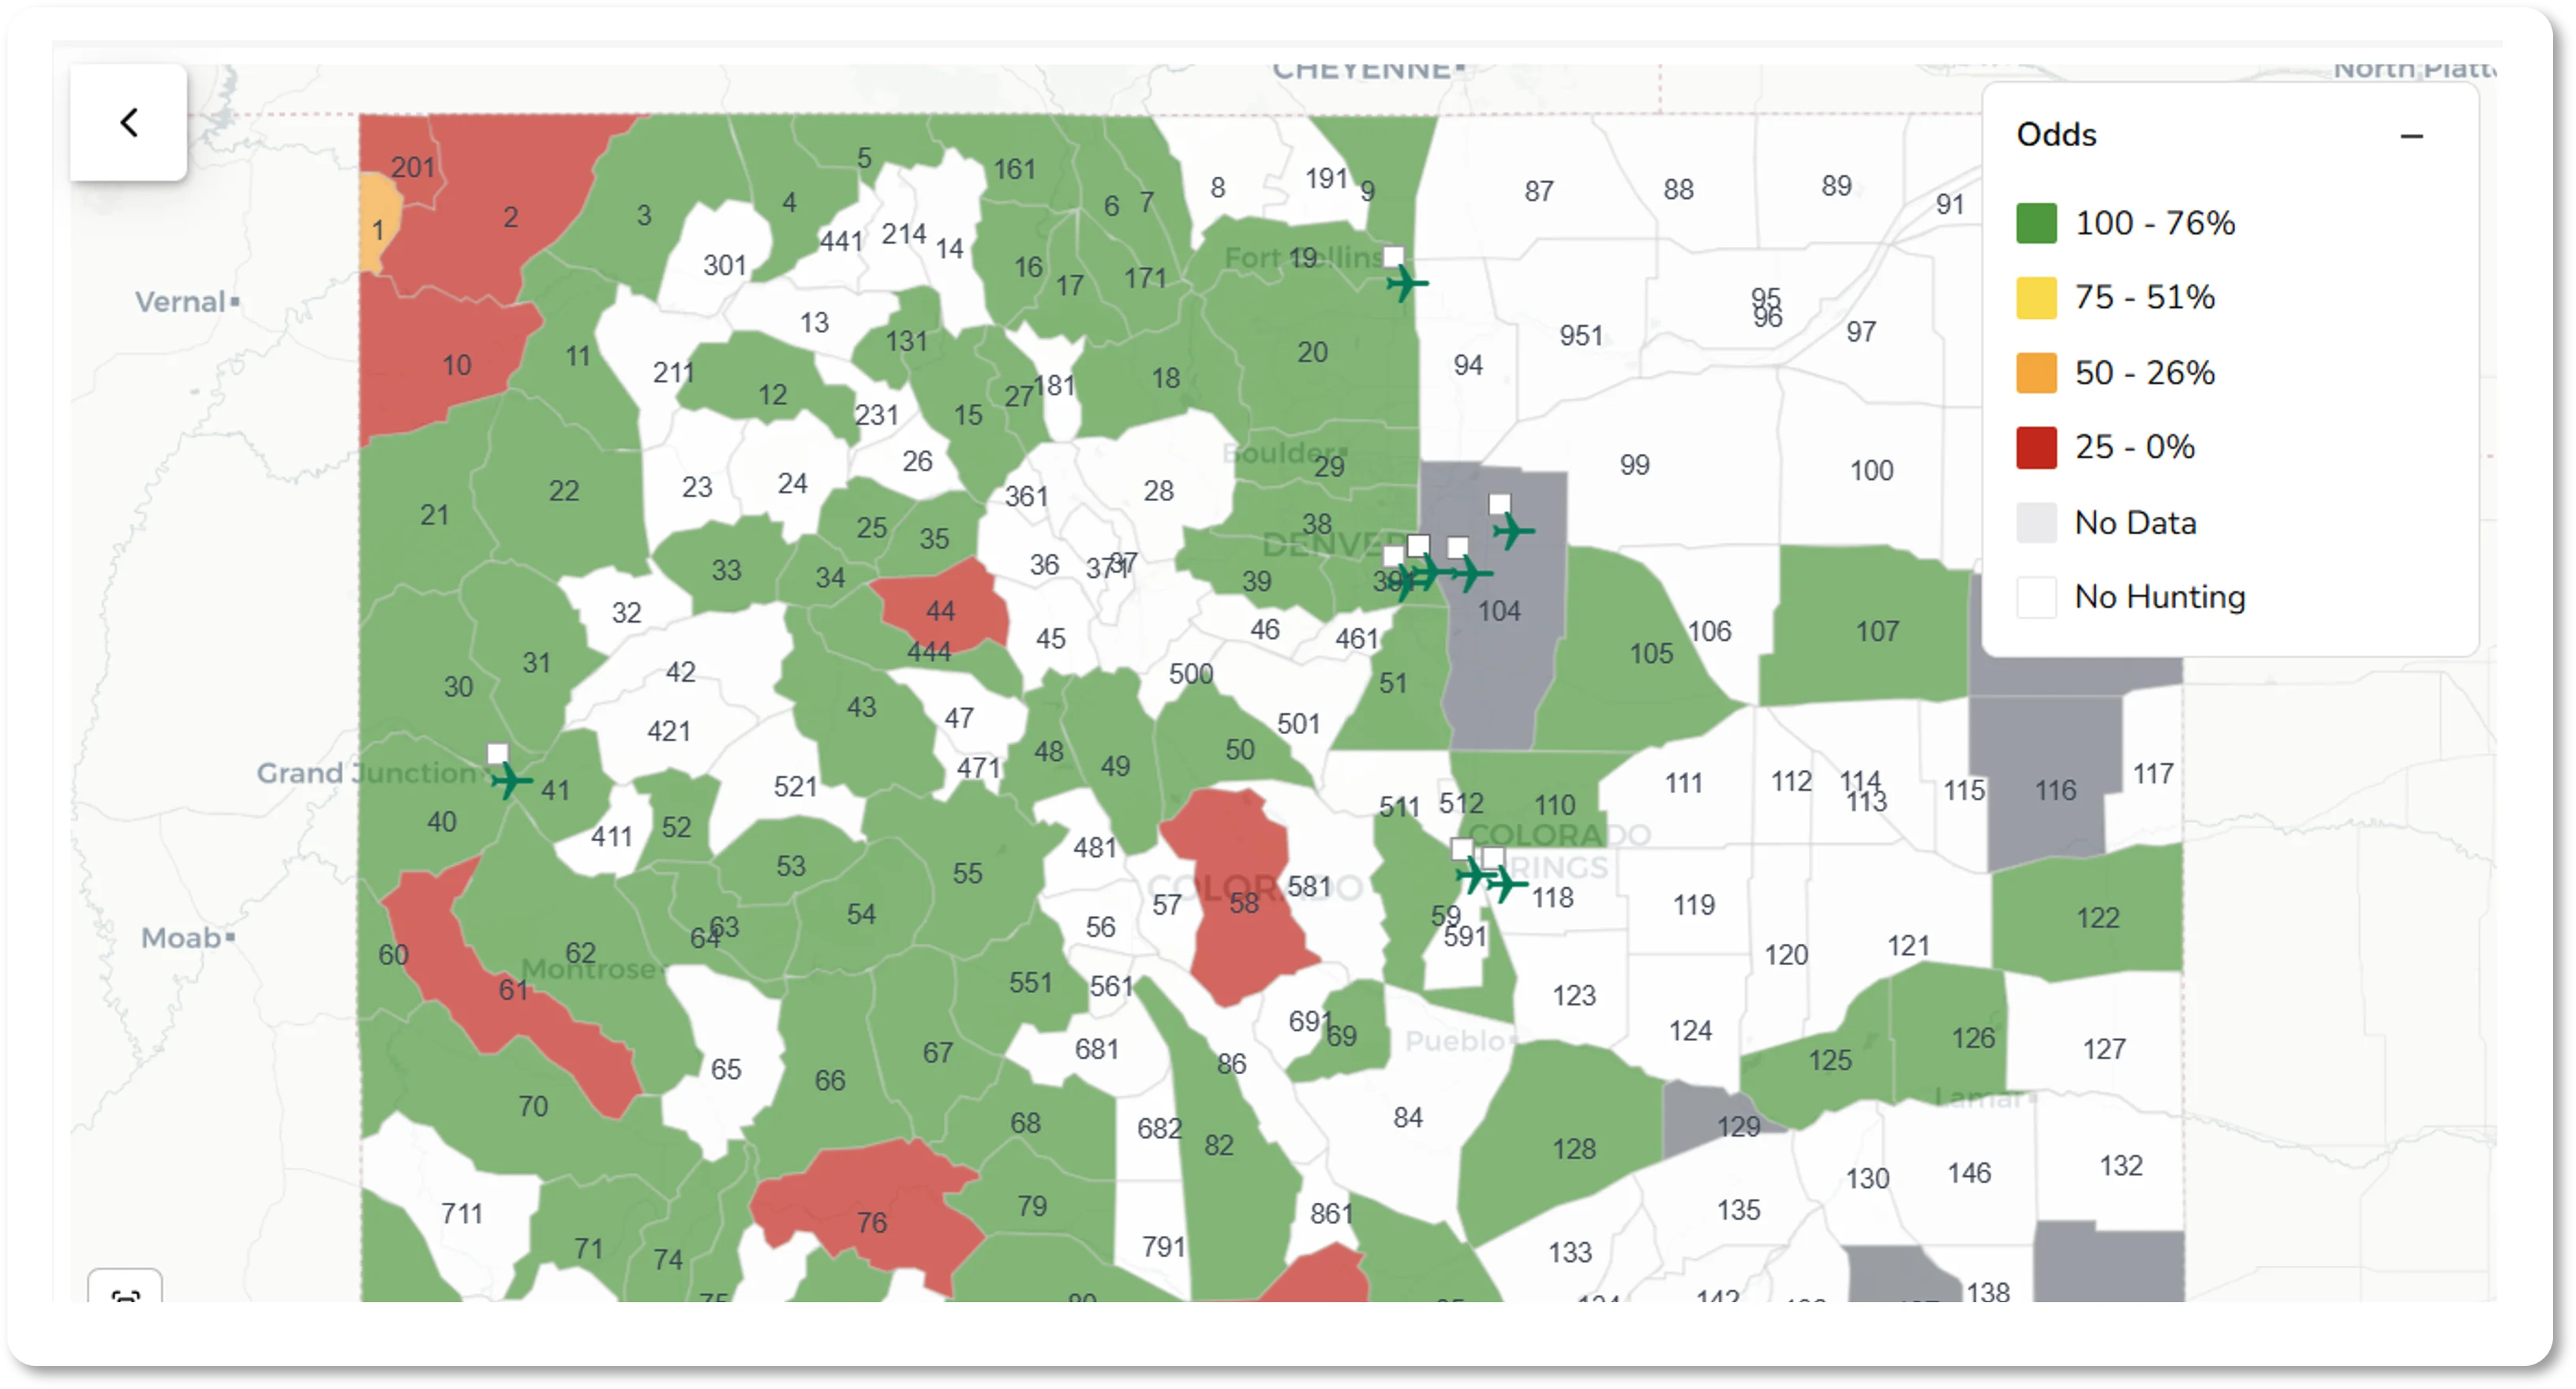
The color-coding follows a traffic-light scheme:
- Green indicates higher odds of drawing
- Yellow shows moderate odds
- Red marks lower odds
These colors reflect your personalized draw odds given your number of points and residency status.
In the unit list below the map, you'll see each unit's GMU code alongside the percentage representing your chances of drawing. You can sort the table by GMU code or by odds value, giving you two different ways to scan the data. The map legend shows the percentage ranges that correspond to each color band, helping you quickly understand what the visual coding means.
How TAGZ Calculates Draw Odds
Overview
States publish annual draw statistics showing how many hunters applied and how many drew a license for every hunt code, applicant type, and point level. The challenge is that the data comes in a raw format that isn't easily searchable and is often missing from one point level to the next.
TAGZ organizes this complexity and applies consistent rules, so the odds displayed in the Dashboard are logical and easy to compare. Our approach is transparent and verifiable: every figure can be traced back to the original draw reports.
Granularity
Odds are broken down by species, sex, GMU, season, method of take, and participant type (adult/youth, resident/nonresident). Within each category, we calculate odds for every point level from zero through forty, and for all four priority choices.
Deer, elk, pronghorn, and bear use preference points. Moose, Rocky Mountain bighorn sheep, and mountain goat combine preference and weighted points, but in TAGZ we present them as a single running total for simplicity. Desert bighorn sheep do not use points at all; their draw remains purely random each year.
In some cases—most notably for moose, and for certain deer and elk hunts in 2021–2022—CPW combined applicants and winners across multiple hunt codes. When this occurred, we assigned the same odds across all affected codes.
For hunt codes or years without applicants or without any published results, we make no assumptions. These are marked as "no data" in the Dashboard.
Calculation Rules
We calculated historical odds for a given hunt code, participant type, and point level as:
Odds = Number of Winners ÷ Number of Applicants
Then we filled the gaps where the data was missing according to the rules below.
The final odds figure shown for every hunt code, participant type, and point level is averaged from adjusted annual values for years 2021–2025.
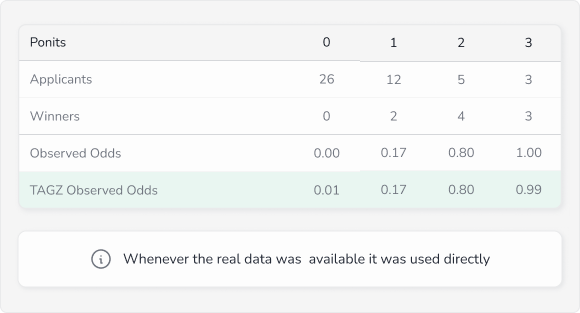
1. Real Data Anchors
Whenever recap reports provide actual results—applicants and winners—those values are treated as anchor points. They remain unchanged, and all adjustments are made in relation to them.
Example: 2025, DM012O4R, Adult, Nonresident
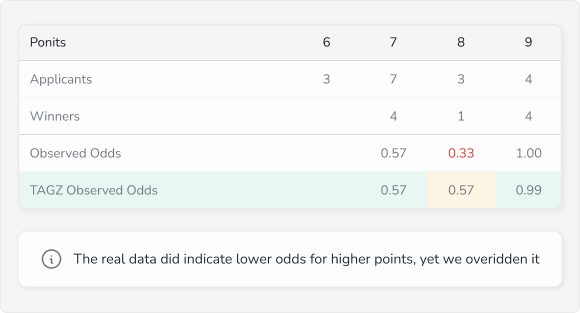
2. Odds Never Go Down
Because of the random nature of the draw, there are rare cases where hunters with more points miss out while someone with fewer points succeeds. We treat these as exceptions. In TAGZ, odds never go down—once they reach a level, they either stay flat or continue to rise with more points.
Example: 2025, EM048O1M, Adult, Nonresident
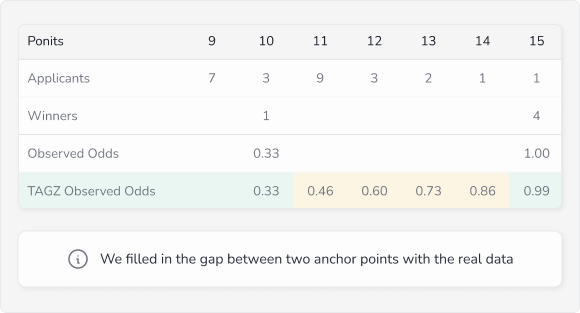
3. Filling the Gaps
Where point levels are missing between known results, we fill the space by connecting the nearest anchors with a gradual slope. This preserves continuity without overcomplicating the data.
Example: 2024, BE851O5R, Adult, Resident
4. High Odds and Floors
When odds climb into the high 90s, we cap them at 99% and extend that value forward, since no license is ever legally guaranteed. At the other end, if hunters applied but none drew, we set odds to a minimum of 1% to reflect the very slim but real chance of success.
5. Conservative Extension for Incomplete Data
For rare species hunts where hundreds of applicants compete for just one to four tags, the extreme competition means odds may never meaningfully improve regardless of point accumulation. When draw statistics show consistently low success rates that don't reach higher point levels, we extend the last known odds value. This conservative approach maintains data continuity without making unfounded assumptions.
Together, these rules ensure the odds you see in TAGZ reflect reality, stay consistent across species and units, and remain fair to interpret at every point level.
Understanding the Points System
Preference Points and Weighted Points
Colorado uses two types of point systems depending on the species:
Preference Points: Used for deer, elk, pronghorn, and bear. When you apply and don't draw, you earn a preference point. In future draws, applicants are grouped by point totals, and tags are allocated to the highest point groups first.
Weighted Points: Used for moose, Rocky Mountain bighorn sheep, and mountain goat. For these species, you must first accumulate three years of preference points before entering the weighted point pool. Once there, each point you hold gives you one additional entry in a random draw, so more points mean more chances, but success is never guaranteed.
Random Draw: Desert bighorn sheep do not use points. Every applicant has an equal chance each year regardless of history.
TAGZ consolidates preference and weighted points into a single running total for simplicity, so you always see your complete point balance for each species in your wallet.
Dive Into Unit Profiles
Once you've identified promising units on the dashboard, click on any unit in either the map or the table to open its Unit Profile. This is where you move from big-picture comparisons to detailed analysis.
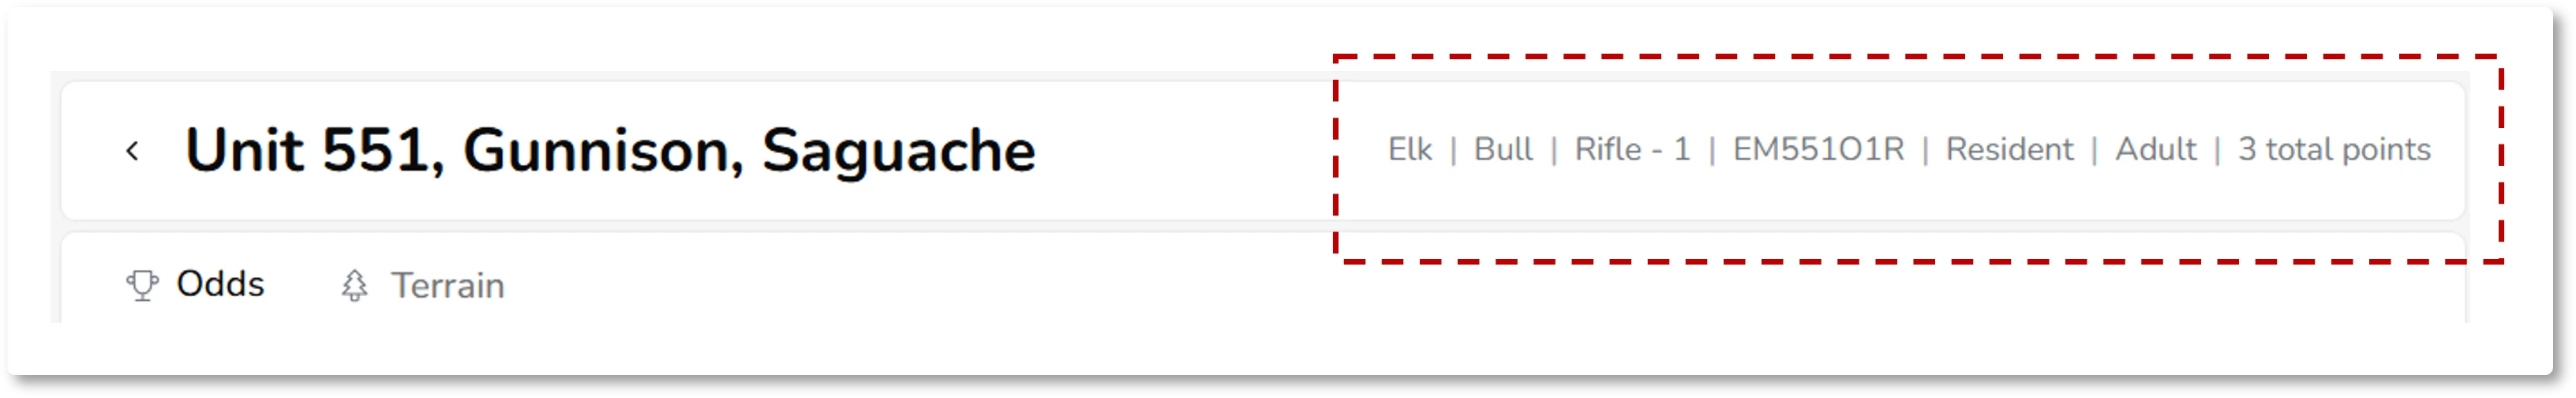
At the top of the unit profile, you'll see a summary of all your active filters (species, animal type, weapon, and season) along with the hunt code you'll need when submitting your draw application.
Odds Tab
The Odds tab is the first thing you'll see when opening a unit. It contains several views that help you evaluate your chances from different angles.
Odds by Points (Default View)
The central chart shows how your odds of drawing change depending on the number of points you have. By default, you see the average odds calculated across the past five years of draw data. This smoothed view helps you understand the general trend without getting distracted by year-to-year noise.
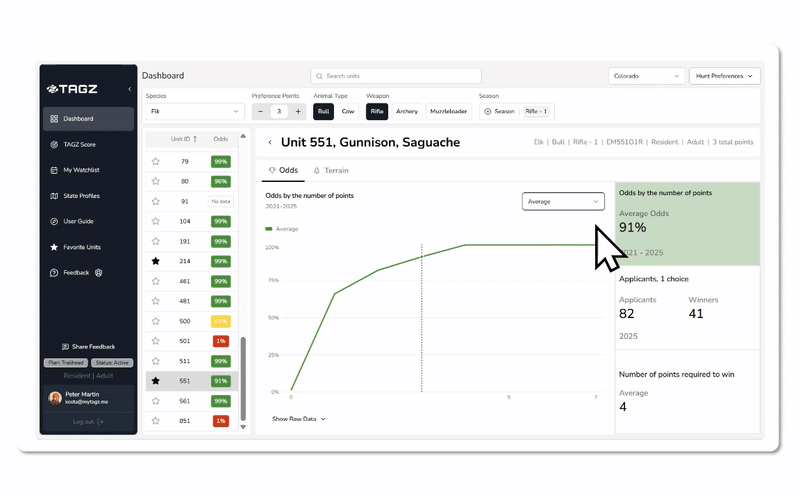
You can also toggle to show individual annual curves alongside the average. This reveals whether a unit's competitiveness is rising, falling, or holding steady, and helps you spot recent shifts in demand.
The chart provides full visibility across the point spectrum, so even though you have a fixed number of points as an individual, you can see exactly how your odds would improve if you waited another year or two.
Applicants View
Switch to the Applicants view to see a historical graph of total applicants by year over the five-year period. The graph is split into winners (those who drew tags) and other applicants, so you can quickly assess how many people applied and how many succeeded.
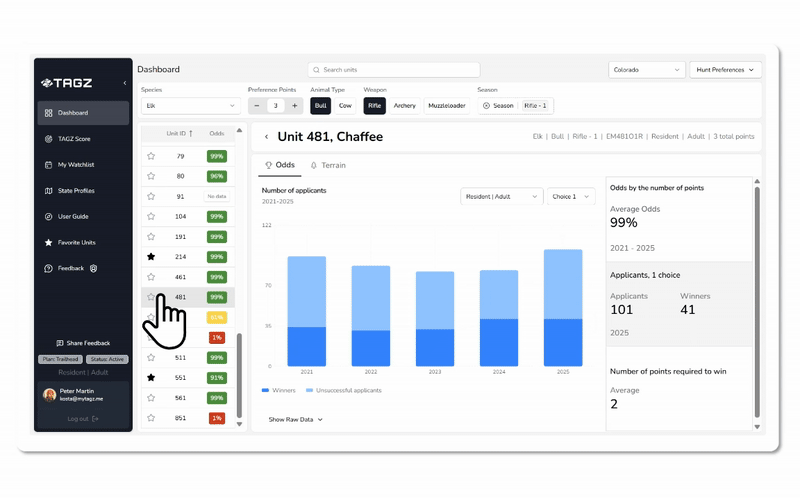
This view can be filtered by participant type (resident adult, resident youth, nonresident adult, nonresident youth) and by choice number. Understanding applicant and winner trends across these dimensions helps you strategize where to place your most competitive applications.
Number of Points Required to Win View
This view shows how many points were required to draw a tag with 95 percent confidence over the past five years. This metric (calculated by TAGZ from historical data and not published by CPW) gives you a clear benchmark to compare against your own point total.
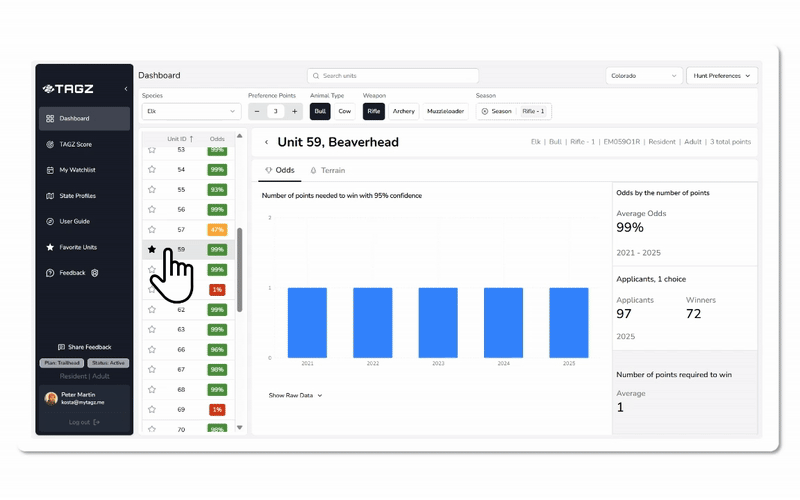
If the required point level is consistently above your current balance, you know the unit is highly competitive and may require patience or a different strategy. If the trend is declining or your points exceed the threshold, you're in a strong position to apply with confidence.
Together, these views help you evaluate your chances in multiple ways: by keying in your points to see your exact odds, by studying the odds curve to understand how competitiveness scales, and by reviewing historical point requirements to gauge recent trends.
Terrain Tab
The Terrain tab is independent of season, weapon, and species. It focuses entirely on the physical characteristics of the unit and what you can expect in the field.
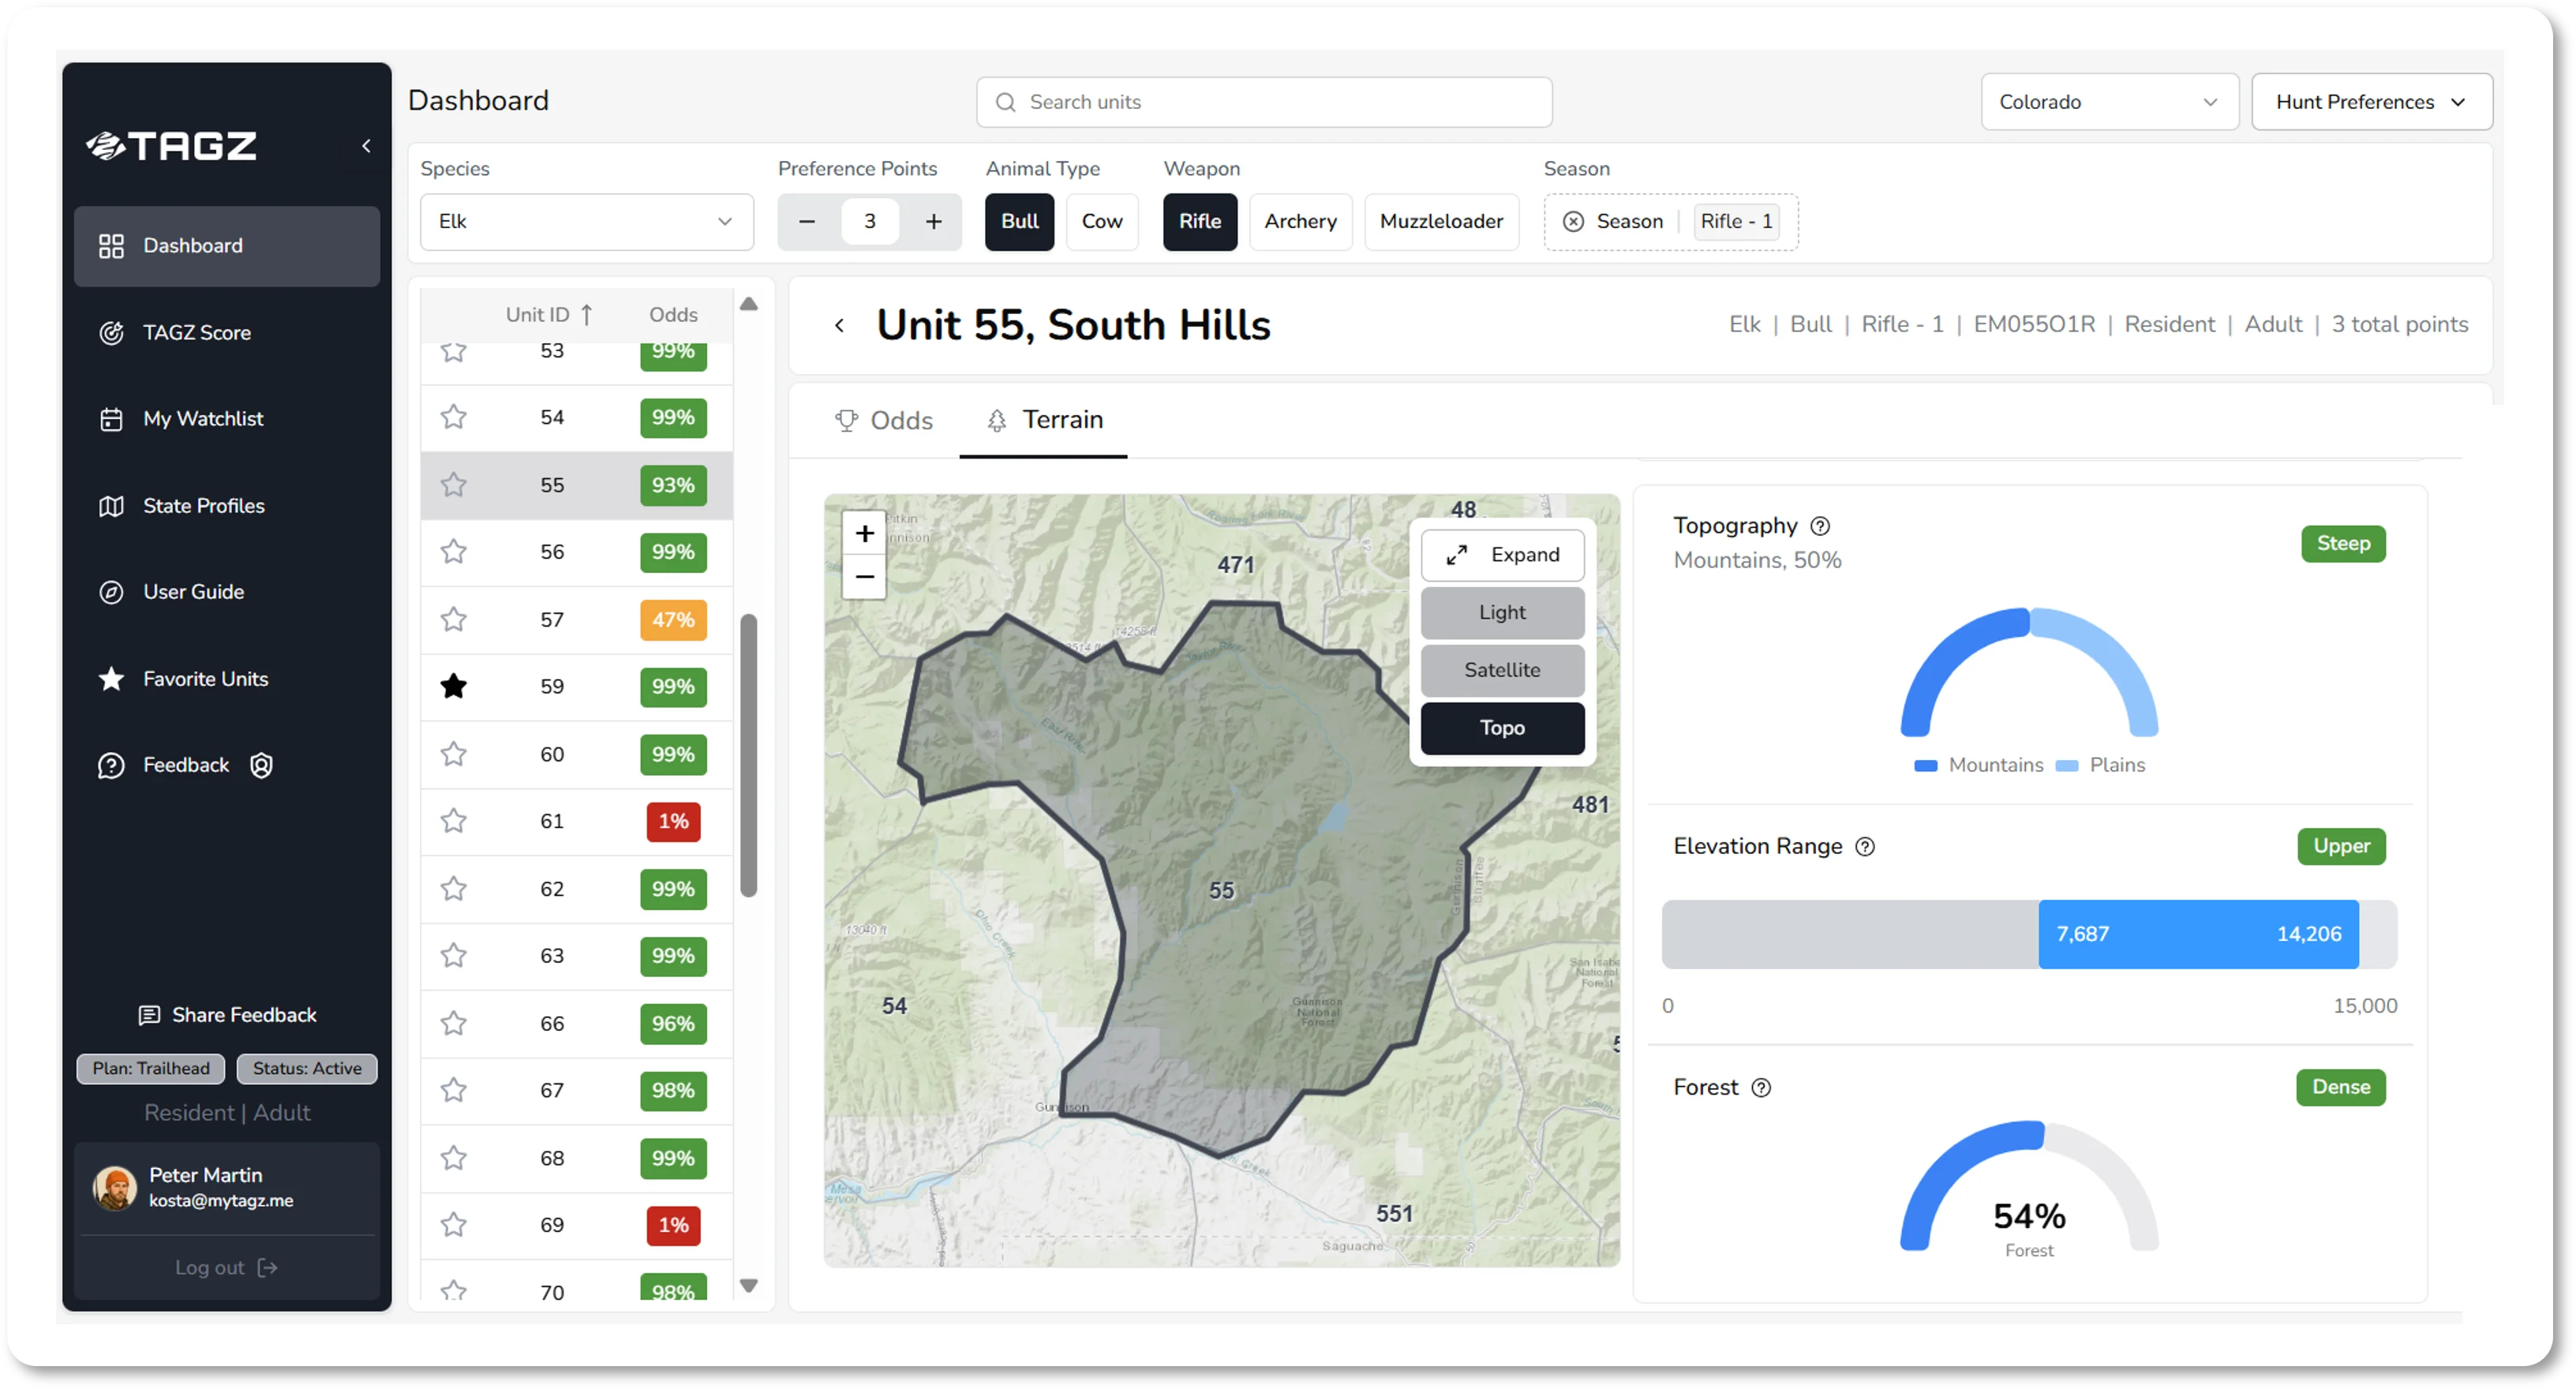
At the top, you'll see a detailed topographic map of the unit with options to switch between satellite, light, and terrain layers. This map includes roads, trails, and terrain features, giving you a real sense of how to navigate the area.
Below the map, TAGZ provides comprehensive unit data including area size, elevation range, public land percentage, topography breakdown, forest coverage, water density, and road and trail accessibility. Each metric includes context badges (such as "Vast," "Most," "Moderate," "Fair") that help you quickly compare units at a glance. These statistics are derived from state and federal sources including USGS elevation data, USFS and BLM land ownership records, NLCD land cover datasets, and NHD hydrography data.
The unit description synthesizes these data points into a readable narrative that explains the landscape, habitat zones, key landmarks, water sources, access considerations, and seasonal movement patterns. This helps you understand not just the numbers, but what hunting in that unit actually looks like and how to approach it strategically.
Additional Tools and Features
TAGZ Score™
Some units may show draw odds near 100 percent, making them look equally achievable on paper. But that doesn't mean they're equal in the field. TAGZ Score™ helps you differentiate between units that might otherwise look similar and uncover hidden gems by applying your personal hunting preferences.
TAGZ Score combines multiple data layers (topography, elevation range, water availability, public land percentage, and road and trail density) into one clear, comparable ranking. You can adjust sliders to define what matters most to you: perhaps you prefer rolling terrain with plentiful water, generous public access, and fewer roads for lighter hunter pressure. The scoring updates instantly as you adjust your preferences, highlighting the units that best fit your style.
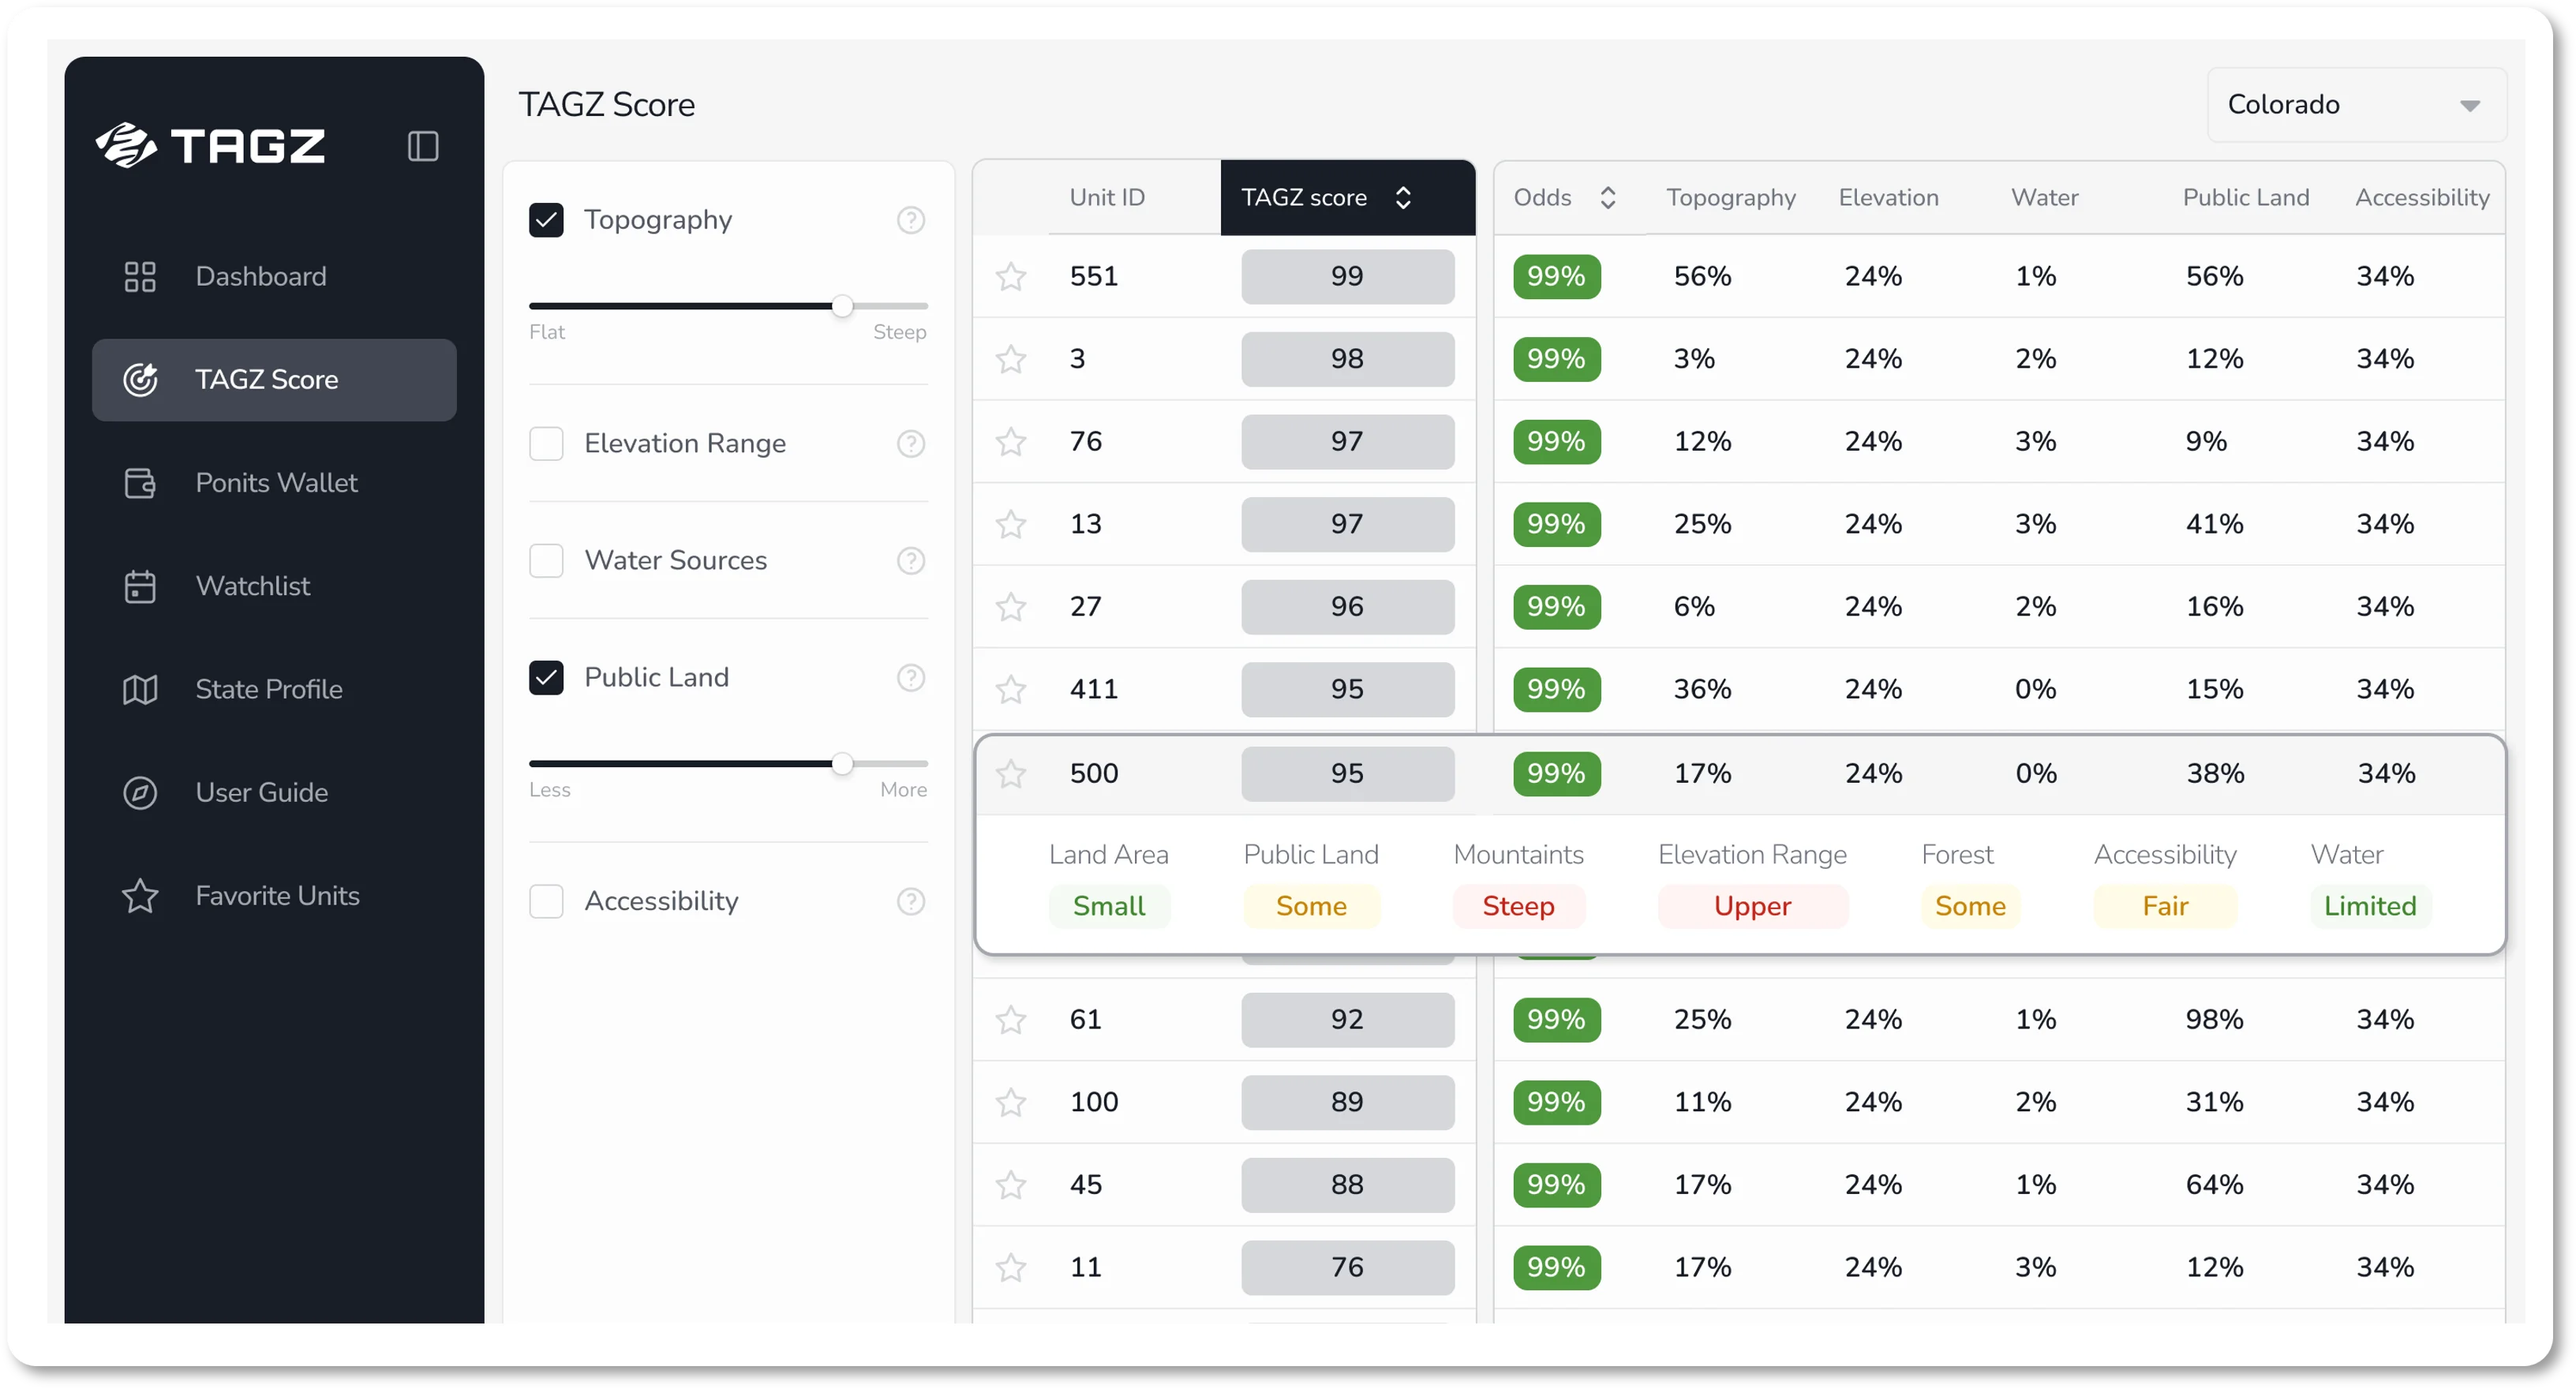
Keep in mind that enabling more drivers at once can create conflicting priorities, but that also means the results become uniquely tailored to your hunting preferences. For a detailed explanation of how TAGZ Score works and how to use it effectively, see our separate article on TAGZ Score.
Favorite Units
As you explore units, you can star any unit you find promising. The star appears in the unit list on the main dashboard, and you can access all your starred units by clicking the Favorite Units tab.
Plan Your Draw Strategy
TAGZ removes the complexity of Colorado's draw and points system and turns it into clear planning tools. With personalized odds, detailed unit analysis, comprehensive season coverage, and transparent methodology, you can confidently decide when to chase premium units and when to use your points for hunts you can realistically achieve.
Track your points, explore your options, and stay ahead of every season. If you have any questions, you can reach us anytime via live chat or at support@mytagz.me.